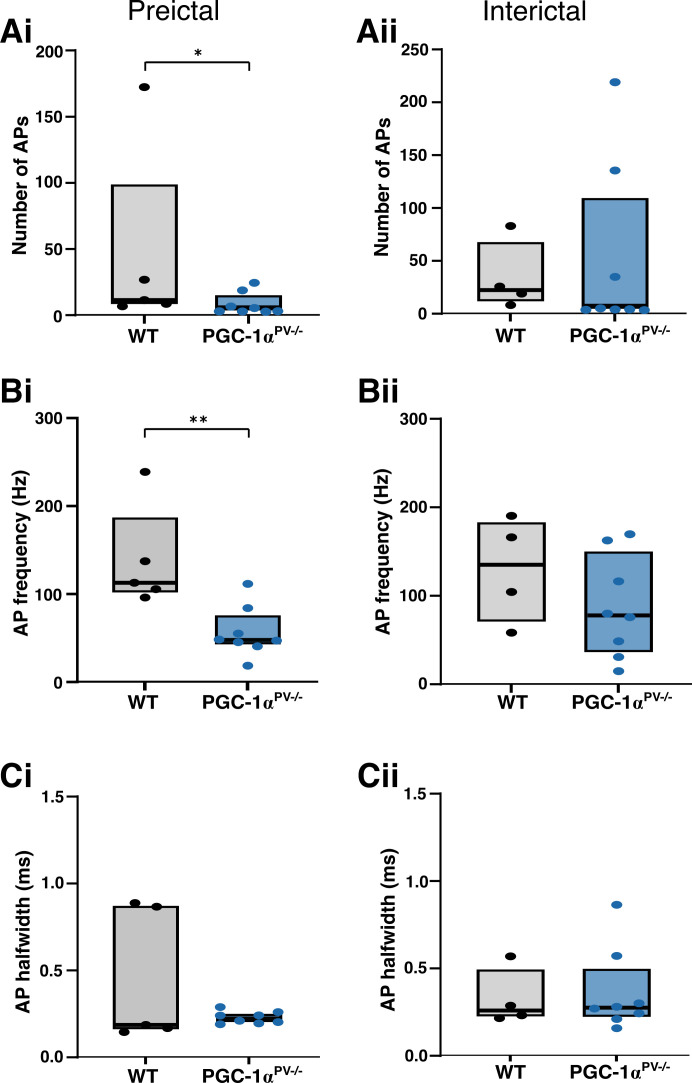
Figure 6.
Action potential (AP) properties of PV interneurons during preictal and interictal events following 0 Mg2+-induced ictogenesis. This figure shows cortical PV interneuron action potential numbers (Ai, Aii, WT, n = 5 brain slices, from 3 mice; KO, n = 8, 4 mice), their frequency (Bi, Bii), and halfwidths (Ci, Cii) during preictal (left column) and interictal events (right column) induced by 0 Mg2+-ictogenic artificial cerebrospinal fluid (aCSF) in control (black) and PGC-1αPV−/− (red) mouse tissue. Data points show the average data per brain slice with the median shown as a black line and the box indicating the interquartile range. *P < 0.05; **P < 0.01. KO, knockout; WT, wild-type.

