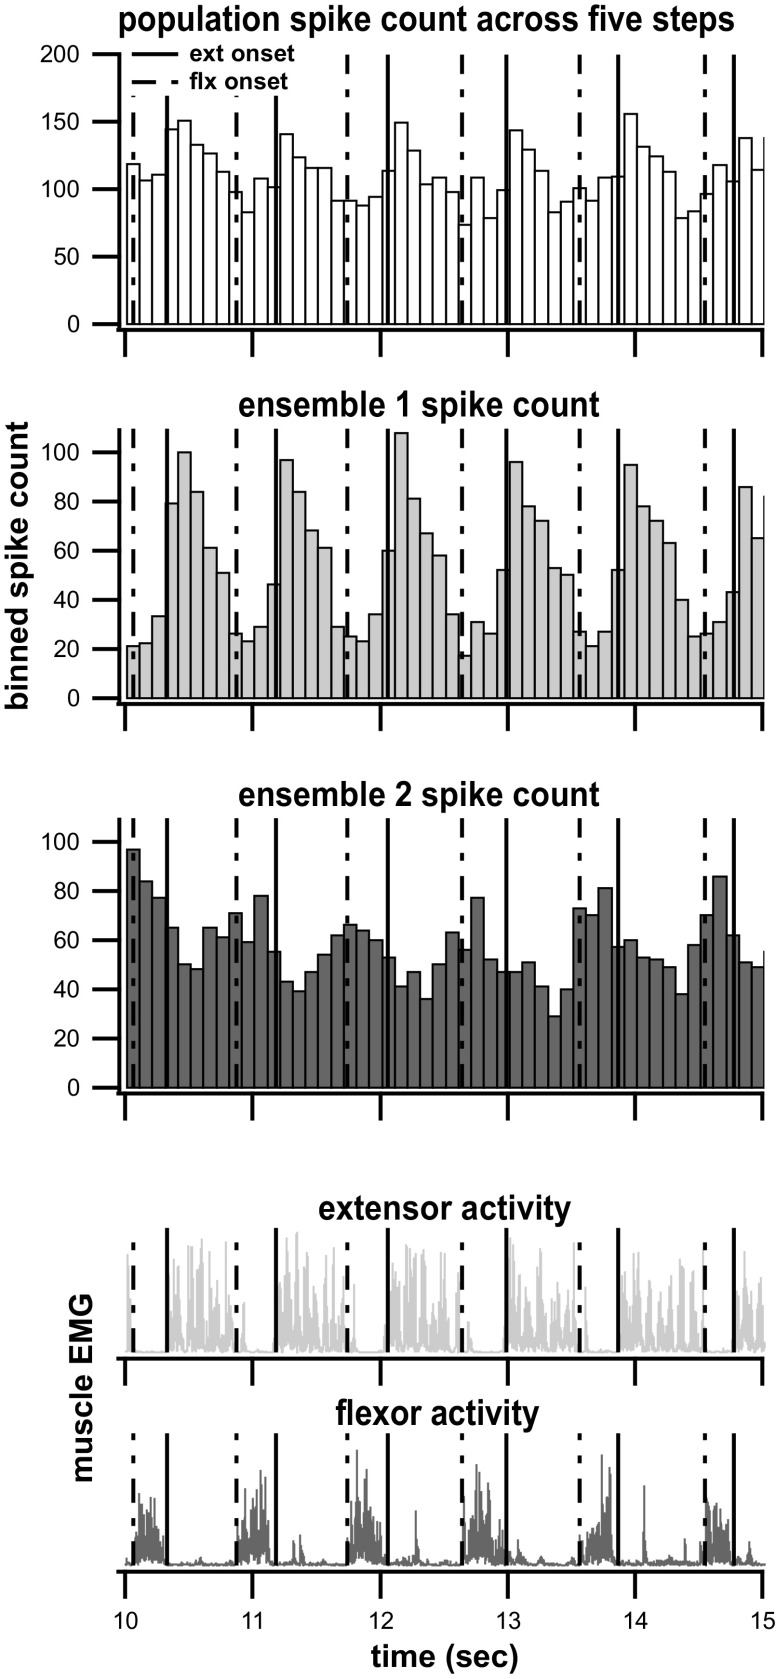
Figure 6.
Community detection ensemble. The top plot shows an example of the binned spike count from the total population. The second and third panels are the ensemble spike counts, as determined via the community detection algorithm. Summed together, these ensemble spike counts would equal the top panel population values. The bottom two panels show the EMG envelopes of the representative ipsilateral flexor and extensor muscles across five steps. The solid vertical lines indicate right extensor onsets and the dashed vertical lines indicate right flexor onsets.

