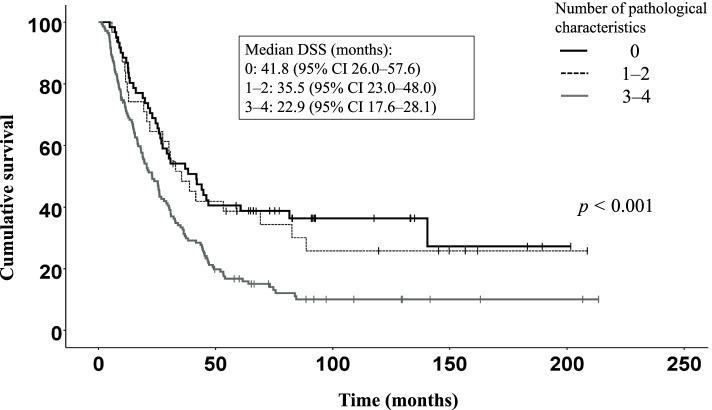
Fig. 1.
Combined effect of perilobular and intralobular fibrosis, acinar atrophy and chronic inflammation (pathological characteristics). Kaplan–Meier overall survival curve stratified by the number of pathological characteristics a patient exhibited in the histological assessment. The overall log-rank (p < 0.001), between 0 and 3–4 pathological characteristics (p < 0.001) and between 1 and 2 and 3–4 pathological charateristics (p = 0.014). We used the Bonferroni correction for multiple comparisons with the decision level set to p < 0.025

