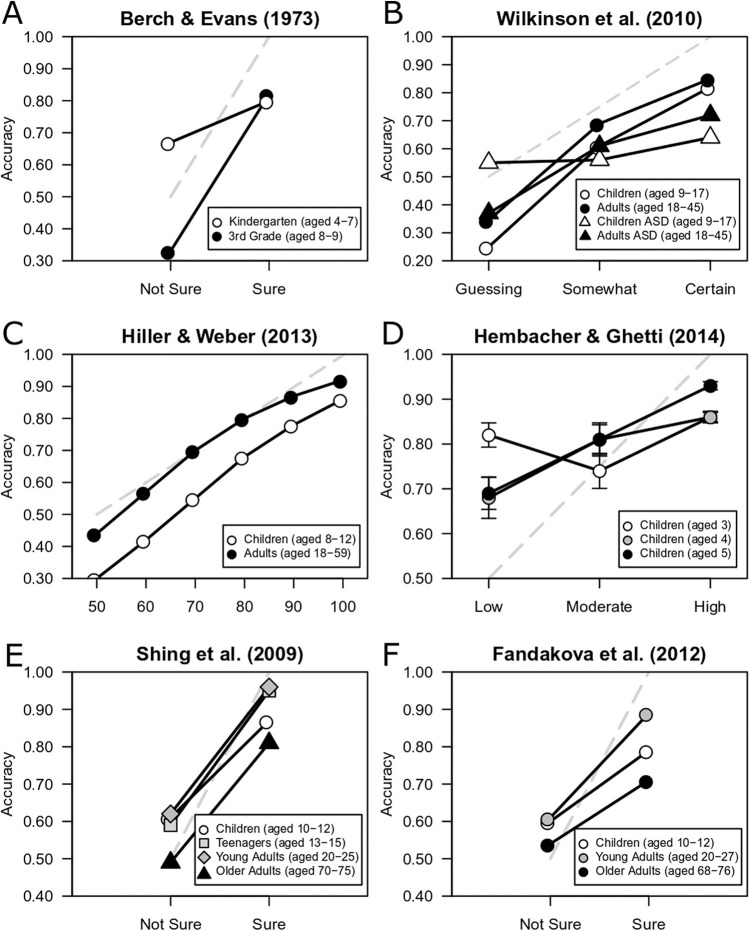
Figure 1. A Confidence Accuracy Characteristic Reanalysis of Data From Six Basic List-Learning Memory Experiments, Plotting Accuracy (Proportion Correct) as a Function of Confidence.
Note. On each plot, the dashed line indicates chance-level performance at the lowest confidence bin and perfect performance at the highest confidence bin. In D, error bars are ±1 SE.

