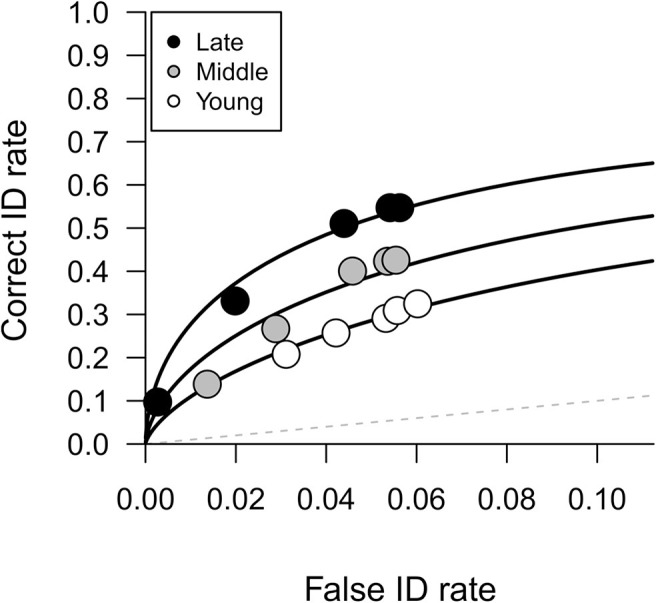
Figure 3. Young, Middle, and Late Childhood Receiver Operating Characte-ristic Data, Plotted Using Postidentification Confidence Judgments.

Note. The circles are the empirical data, and the lines of best fit were generated using the Independent Observations model fit to the data. The bottom x axis shows the estimated false ID rate of innocent suspects. The dashed line indicates chance-level performance.
