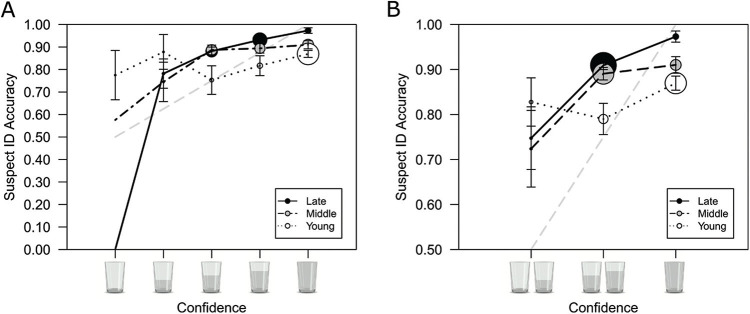
Figure 4. Young, Middle, and Late Childhood Confidence Accuracy Characteristic Data, Plotted Using Postidentification Confidence Judgments on (A) the 5-Point Cup Scale and (B) a Collapsed 3-Point Cup Scale.
Note. Bars represent standard errors, estimated using a bootstrap procedure (see Seale-Carlisle & Mickes, 2016). The dashed line indicates chance-level performance at the lowest confidence bin and perfect performance at the highest confidence bin. The size of the circles represents the number of suspect IDs at a given level of confidence, relative to the number of suspect IDs given at other levels of confidence (Seale-Carlisle, Wetmore, et al., 2019).

