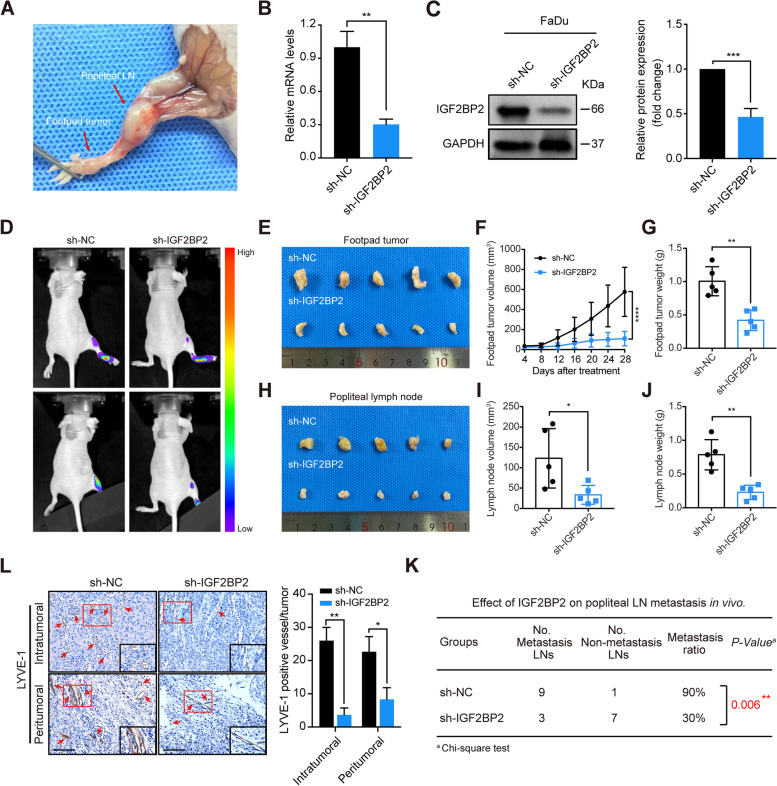
Fig. 4.
IGF2BP2 knockdown suppresses lymphatic metastasis and lymphangiogenesis in vivo. A Representative images of the popliteal lymph node (LN) metastasis model in nude mice. FaDu cells were inserted into the footpads of nude mice through injection, and the metastasized popliteal LNs were harvested and analyzed. B-C RT-qPCR (B) and western blot (C) analysis of IGF2BP2 expression at mRNA as well as protein levels in stably IGF2BP2-silenced cells and control cells. Right panel shows the statistical analysis of western blotting. GAPDH functioned as internal control. **P < 0.01, ***P < 0.001. D Representative images of bioluminescence of popliteal LN metastasis after inhibition of IGF2BP2 (n = 10 per group). E Representative images of enucleated footpad tumors for the indicated groups (n = 10 per group). F-G The volume (F) and weight (G) of footpad tumors for the indicated groups. **P < 0.01, ****P < 0.0001. H Images representing enucleated popliteal LNs for the indicated groups (n = 10 per group). I-J The volume (I) and weight (J) of lymph nodes for the relevant groups. *P < 0.05, **P < 0.01. K The metastatic ratio of popliteal LNs was calculated for all groups (n = 10 per group, P = 0.006). L Representative images of mice tissues immunostained with anti-LYVE-1 antibody in intratumoral or peritumoral regions with different IGF2BP2 expression levels. Red arrows indicate the microlymphatic vessels. Right panel shows the quantification of microlymphatic vessel density. Scale bars: 200 μm. *P < 0.05, **P < 0.01. All the data are presented in the form of mean ± SD from three independently performed experiments

