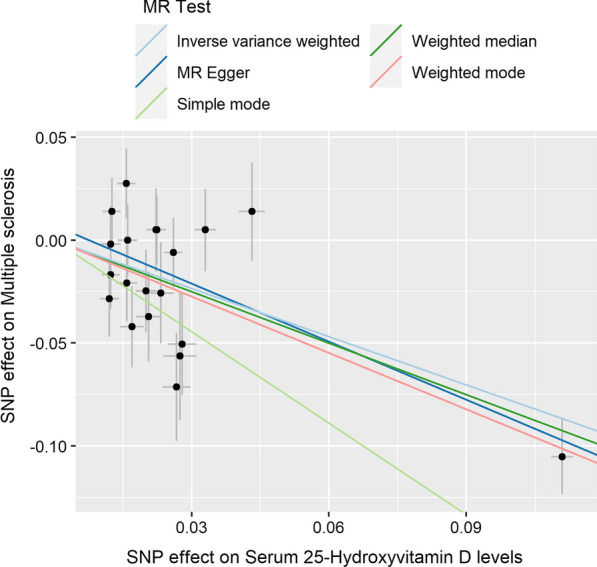
Fig. 2.

Individual estimates about the causal effect of serum 25OHD levels on MS. The x-axis shows the SNP (single nucleotide polymorphism) effect and SE (standard error) on each of the 20 serum 25OHD SNPs from 25OHD GWAS dataset (https://gwas.mrcieu.ac.uk/datasets/ebi-a-GCST90000615/). The y-axis shows the SNP effect and SE on multiple sclerosis (MS) from MS GWAS dataset (https://gwas.mrcieu.ac.uk/datasets/ieu-a-1025/). The regression lines for the MR-egger, weighted median, inverse variance weighted (multiplicative random effects), simple mode, weighted mode method are shown
