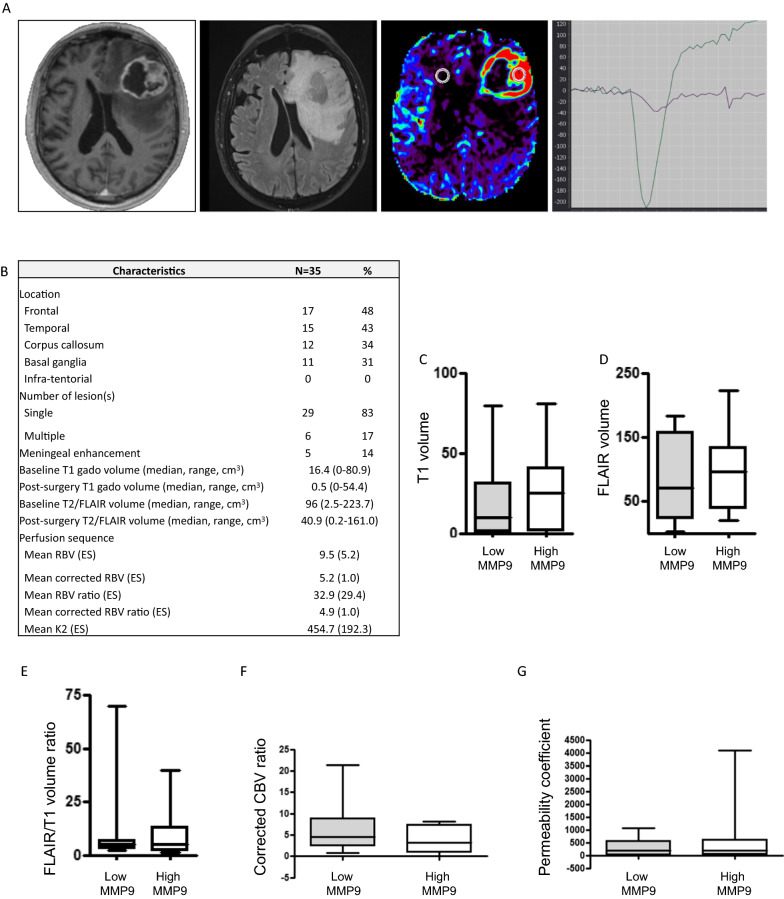
Fig. 3.
Correlation between MMP9 plasma level and neuro-radiological characteristic. A Illustrative magnetic resonance imaging (MRI) showing (from left to right): T1 sequence with contrast enhancement, FLAIR sequence, perfusion sequence and perfusion curve. Round mark: Region Of Interest (ROI) in enhanced tumor (right) and controlateral brain (left, control). B Neuro-radiological characteristics of peri-operative cohort. C T1 volume according to MMP9 plasma level. D FLAIR volume according to MMP9 plasma level. E Infiltrative pattern of glioblastoma (using the FLAIR/T1 volume ratio) according to MMP9 plasma level. F Corrected CBV ratio according to MMP9 plasma level. G Permeability coefficient according to MMP9 plasma level. No significant difference was shown

