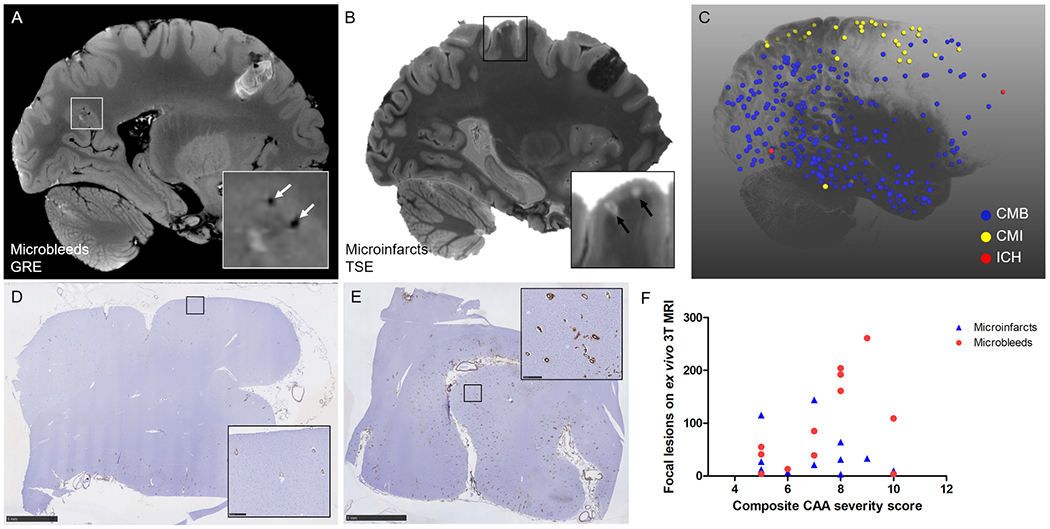
Figure 2.

Whole-brain associations of microbleeds and microinfarcts with CAA severity.
Cortical microbleeds were assessed on the ex vivo 3T MRI gradient-echo (GRE) scans (A) and cortical microinfarcts on the ex vivo 3T MRI T2-weighted turbo-spin echo (TSE) scans (B). The projection of annotated lesions on a 3D reconstruction of a representative hemisphere (case #2) demonstrates that microbleeds (CMB, blue dots) were more often observed in posterior parts of the brain, whereas microinfarcts (CMI, yellow dots) frequently involved the areas of the brain perfused by end arteries (C). Note: red dots are areas affected by intracerebral hemorrhages (ICH). CAA severity was assessed on standard sections from frontal (D, example of score 1), temporal, parietal, and occipital (E, example of score 3) cortex to create a composite CAA severity score. Neither the number of microbleeds (red circles, Spearman’s ρ 0.426, p=0.17) nor the number of microinfarcts (blue triangles, Spearman’s ρ −0.278, p=0.38) were associated with composite CAA severity score (F). Scale bar in D and E = 5 mm.
