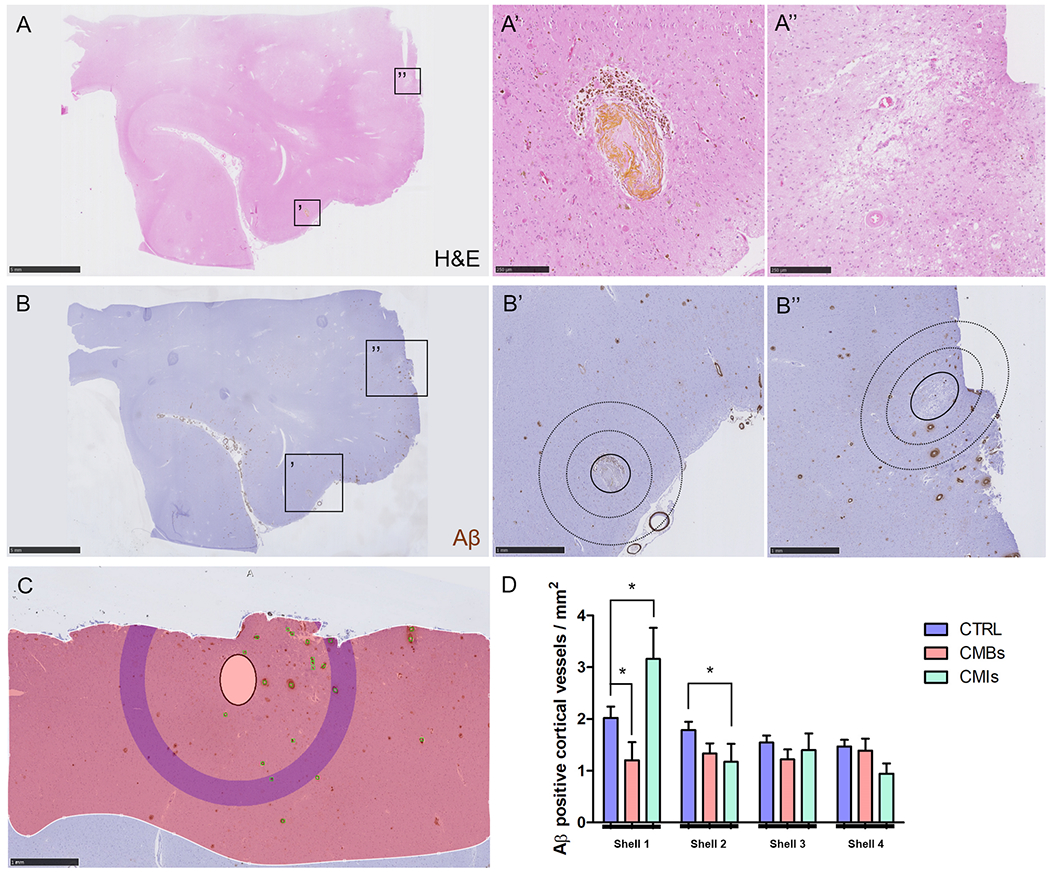
Figure 4.

Local associations of microbleeds and microinfarcts with Aβ positive cortical vessels.
Based on the H&E-stained serial sections (A) from the additional samples taken from the temporal cortex in two CAA cases, 28 microbleeds (A’) and 18 microinfarcts (A’’) were included. Lesions were localized on the adjacent Aβ-stained sections (B) to perform Sholl analysis (B’B’’, inner circle with solid outline indicates masked area, circles with dotted outlines indicate first two shells). After masking of the lesion, Aβ positive cortical vessels were manually annotated (green markers), the cortical ribbon was outlined (red shaded area), and the density of Aβ positive cortical vessels was generated by the software for four concentric circles extending from the outer border of the masked area (C, purple concentric circle in this example is shell 4). Significantly fewer Aβ positive cortical vessels were observed in the first shell immediately adjacent to a microbleed compared to a simulated control lesion (p=0.023), whereas more Aβ positive cortical vessels were observed in the first shell immediately adjacent to a microinfarct compared to a simulated control lesion (p=0.054) (D). For the second shell significantly fewer Aβ positive cortical vessels were observed for microinfarcts compared to simulated control lesions (p=0.039). Scale bar in A and B = 5 mm, scale bar in B’, B’’, and C = 1 mm, scale bar in A’ and A’’ = 250 μm. Error bars in D = SEM.
