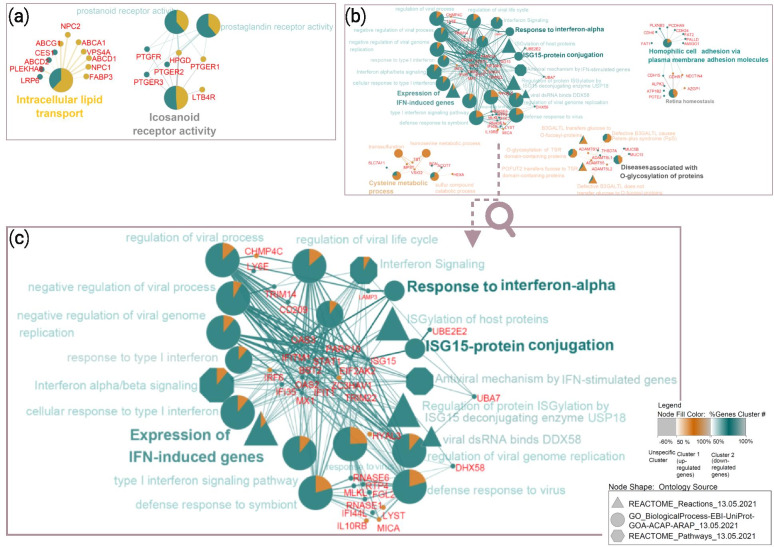
Fig. 2.
Networks of enriched pathways and mapped genes associated with DEGs in the adenomyosis group. (a) Sorted 4 pathways in 2 network groups obtained by the enrichment analysis of 909 DEGs associated with adenomyosis group after comparing receptive, early- and late-receptive case and control samples; (b) Sorted 33 enriched pathways within 7 network groups identified from 382 DEGs associated with adenomyosis group after comparing only case and control samples dated to the receptive phase; (c) The enlargement of the connected network groups “Expression of IFN-induced genes”, “Response to interferon-alpha” and “ISG15-protein conjugation” presenting candidate pathways for future studies associated with altered endometrial receptivity in adenomyosis. Each set of DEGs was uploaded in the Cytoscape ClueGO app as two separate clusters, where upregulated genes were marked with violet and downregulated genes with green colour. Shape of nodes in networks attributed to ontology sources that were applied for enrichment analysis. Enriched pathways were sorted into network groups based on their common biological role

