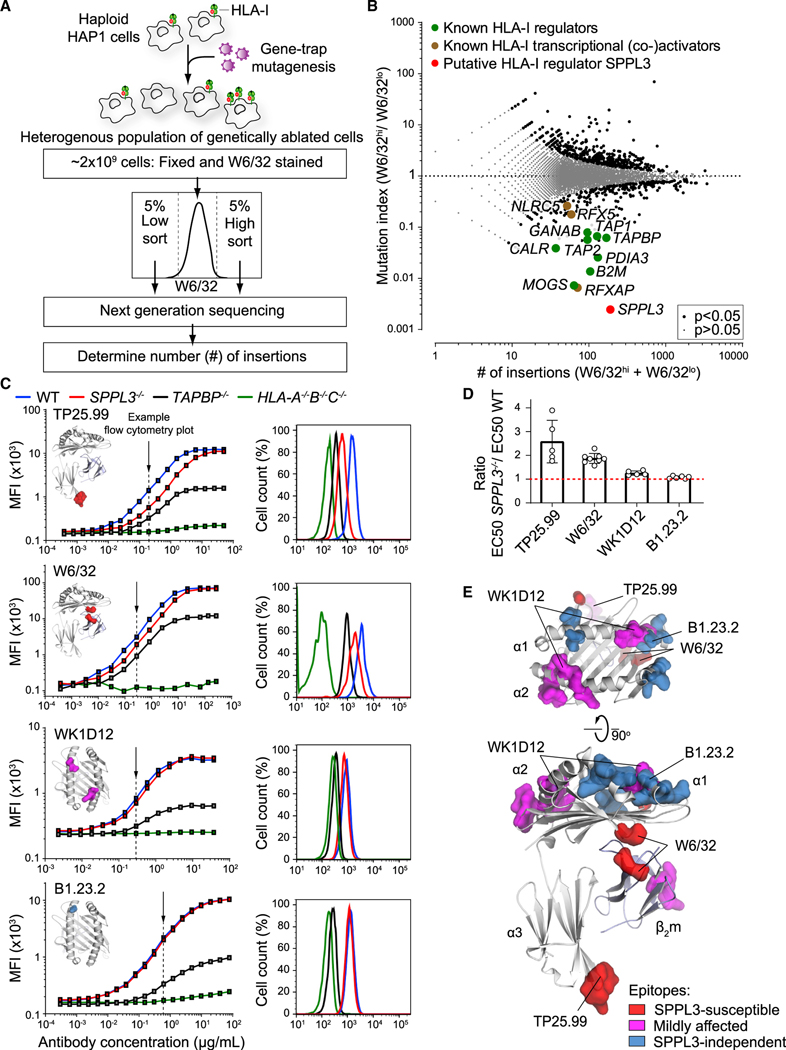
Figure 1. A Haploid Genetic Screen Reveals SPPL3 as a Regulator of Antibody Accessibility to Membrane-Proximal HLA-I Regions.
(A) Schematic overview of a genome-wide haploid genetic screen using HLA-I-specific W6/32 antibody.
(B) Fish-tail plot showing per gene the mutation index (ratio of integrations mapped in the specified populations) against the amount of mapped integrations. A two-sided false discovery rate (FDR) (Benjamini-Hochberg) corrected Fisher’s exact test was applied. The symbol legend is indicated.
(C) (Left) Titration curves of four HLA-I-specific antibodies on mixed barcoded HAP1 cells (see Figure S1E). The individual antibody binding epitopes are shown on the HLA-I structure. (Right) Flow cytometry histograms of nonsaturating antibody stain as indicated by the arrow (close to EC50 values). MFI, mean fluorescence intensity.
(D) Quantification of (C) using the ratio of WT and SPPL3−/− EC50 values. Mean ± SD is plotted (n = 5–8 independent experiments).
(E) SPPL3-susceptibility of different epitopes is plotted on the HLA-I/β2m crystal structure (individual epitopes in Figures 1C and S2A).
See also Figures S1 and S2.

