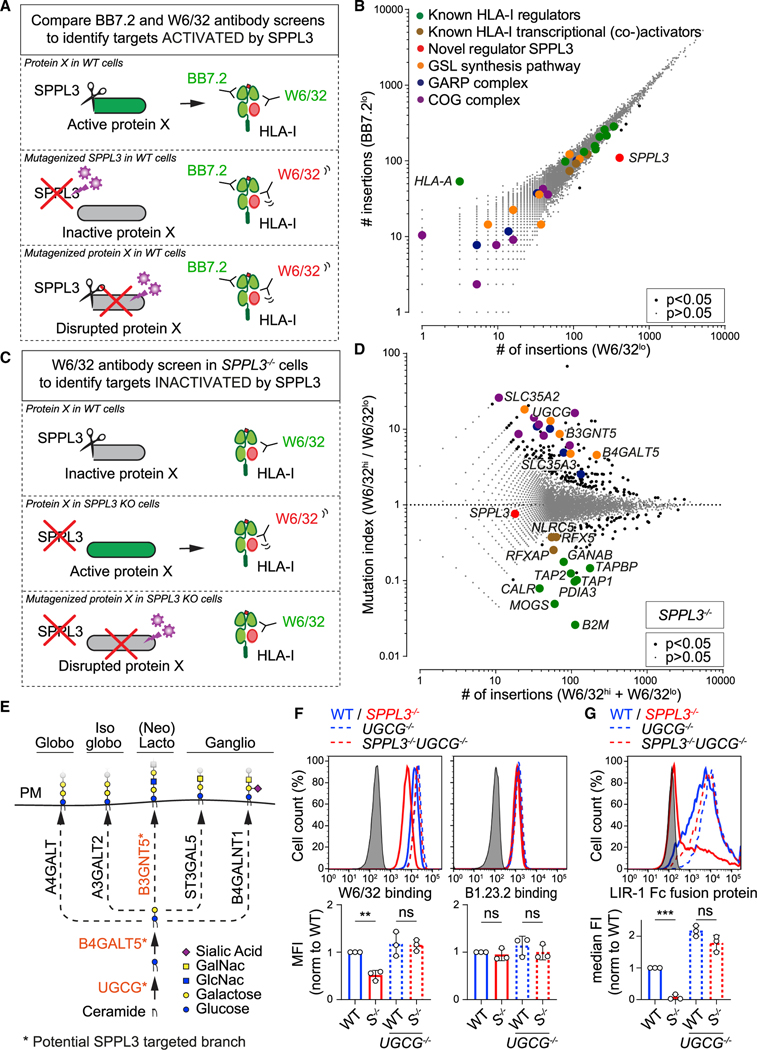
Figure 3. SPPL3-Controlled GSLs Modulate Receptor Accessibility to HLA-I.
(A–C) Schematic outlines of screening strategies to discover potential HLA-I regulators activated (A) or inactivated (C) by SPPL3. (B) Rocket plot of haploid genetic screens comparing the number of unique disruptive integrations per gene in BB7.2lo- and W6/32lo-sorted HAP1 populations. Two-sided FDR corrected Fisher’s exact test was applied. The symbol legend is indicated (see also Figure S4A).
(D) Fish-tail plot of the haploid genetic screen in SPPL3−/− HAP1 cells, showing per gene the mutation index (ratio of integrations mapped in indicated populations) against the amount of integrations. Statistics and color legend as in (B) (see also Figure S4B).
(E) Schematic overview of the core enzymes involved in the synthesis of GSL subtypes. The putative SPPL3-targeted branch is shown in orange. PM, plasmamembrane.
(F and G) Histograms of W6/32, B1.23.2 (F), and LIR-1 Fc (G) surface staining of the indicated HAP1 cells. Quantification (MFI, F; or median fluorescence intensity [median FI], G) is shown as mean ± SD (n = 3 independent experiments). Gray, unstained controls; S−/−, SPPL3−/−.
ns, not significant; ** p<0.01; *** p<0.001. See also Figure S4.

