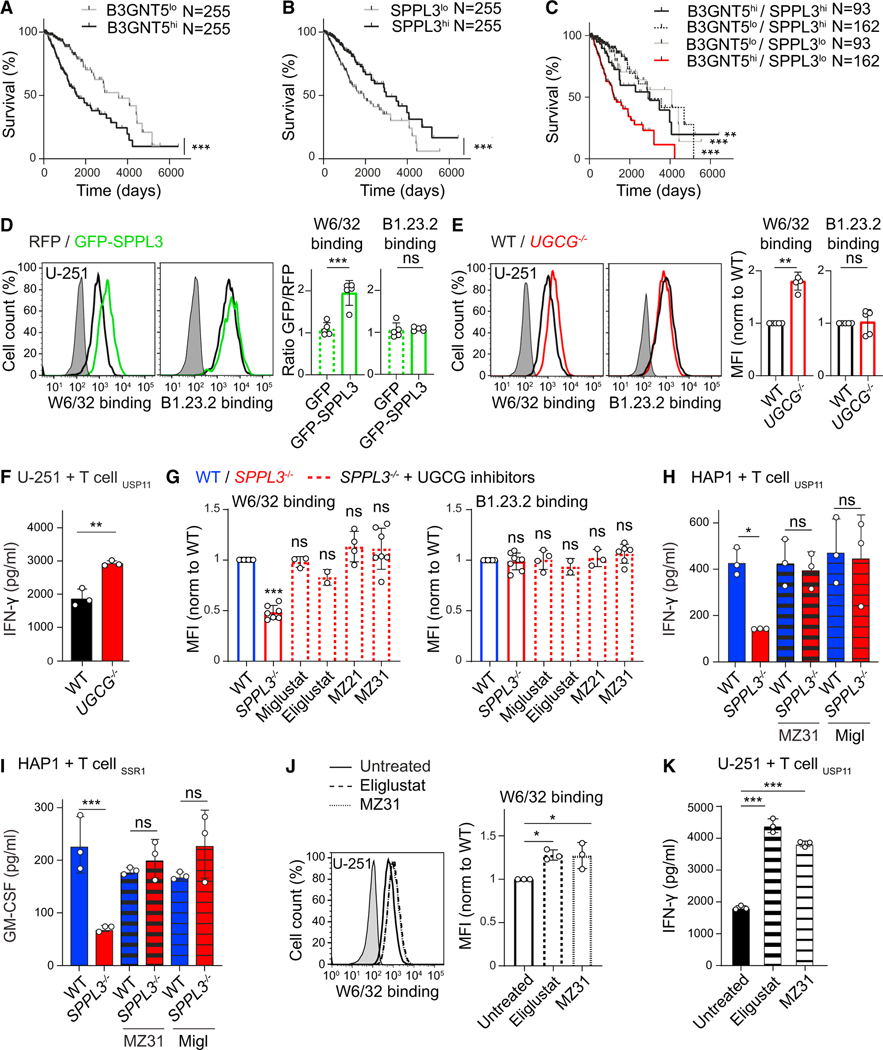
Figure 7. Pharmacological Inhibition of GSL Synthesis in Glioma Enhances Anti-tumor Immune Responses.
(A–C) TCGA-derived Kaplan-Meier curves showing the survival of patients with tumors expressing low or high B3GNT5 (A), low or high SPPL3 (B), or any of the four combinations thereof (C) (see Figure S7A).
(D) Histograms of W6/32 and B1.23.2 binding to U-251 glioblastoma cells overexpressing GFP-SPPL3 or RFP-EV, combined in a single well. Quantification (MFIGFP+ cells/MFI RFP+ cells) includes a GFP-EV control (n = 5).
(E) Histograms and normalized MFI of the depicted antibody staining of WT and UGCG−/− U-251 cells (n = 4–5) (see Figure S7B).
(F) IFN-γ secretion by the indicated T cells against WT or UGCG−/− U-251 cells (n = 3).
(G) Normalized MFI of the depicted antibody staining of the indicated HAP1 cells precultured with specified UGCG inhibitors (n = 2–7) (see Figures S7C–S7F). (H and I) IFN-γ or GM-CSF secretion by the indicated T cells cocultured with WT or SPPL3−/− HAP1 cells that were precultured with or without the specified UGCG inhibitor (n = 3) (see Figure S7G for more T cell clones).
(J) Histogram and normalized MFI of W6/32 binding to WT U-251 cells precultured with the indicated UGCG inhibitors (n = 3) (see Figure S7H).s
(K) IFN-γ secretion by the indicated T cells after coculture with the depicted inhibitor-pretreated U-251 cells (n = 3).
Gray histograms are unstained controls. Mean ± SD of n independent experiments is plotted in (D), (E), (G), and (J). A representative of n experiments is shown in (F), (H), (I), and (K). ns, not significant; * p<0.05; ** p<0.01; *** p<0.001. See also Figure S7.

