Fig. 3.
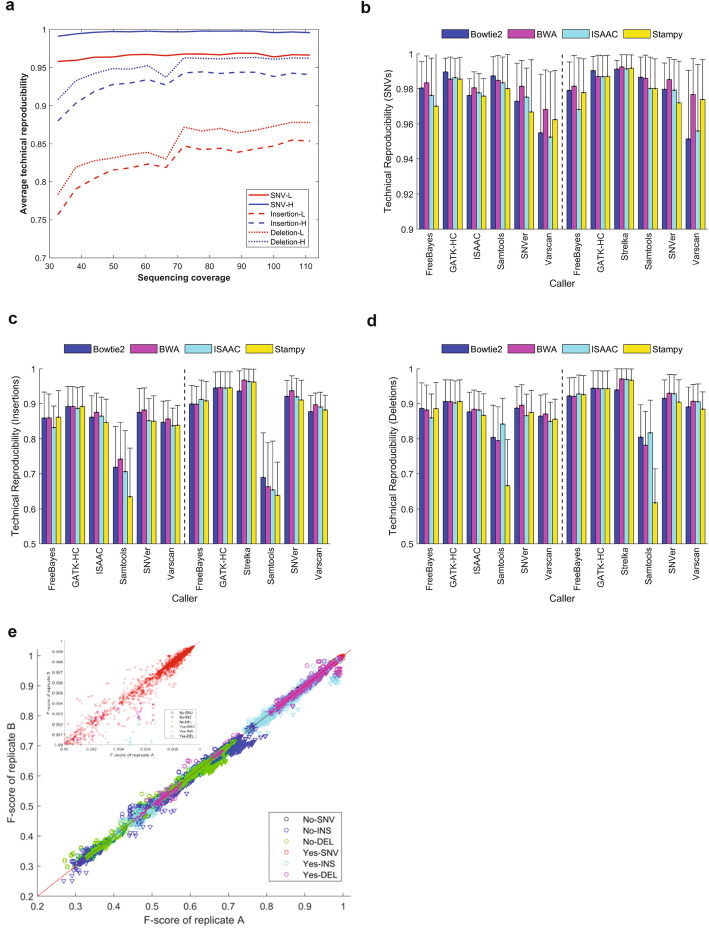
Technical reproducibility. a Impact of sequencing coverage on technical reproducibility. Average technical reproducibility (y-axis) of detected variants is plotted against the sequencing coverage (x-axis). Line types indicate variant types (SNVs: solid lines, insertion: dash lines, deletion: dot line). Red lines represent upper bounds of technical reproducibility and blue lines are lower bounds of technical reproducibility. b,c,d Technical reproducibility across aligners and callers for SNVs (b), insertions (c), and deletions (d). The average technical reproducibility of variants for pairs of callers (x-axis) and aligners (color legend) are plotted as bars with their standard deviation as sticks. The left panels give the results from the original data and the right panels show the results from the confirmatory data. e F-scores of technical replicates. The F-scores from one technical replicate (x-axis) are plotted against the F-scores from another technical replicate (y-axis). The marker colors represent types of variants indicated at the right bottom corner with two-word text. The first indicates HRR filtering (Yes and No) and the second for variant type (SNV: SNVs, INS: insertions, DEL: deletions). The downward triangles represent the F-scores from the original study, while the circles mark the F-scores from the confirmatory study. The inserted figure at top left is a zoom-in of the F-score > 0.99 region

