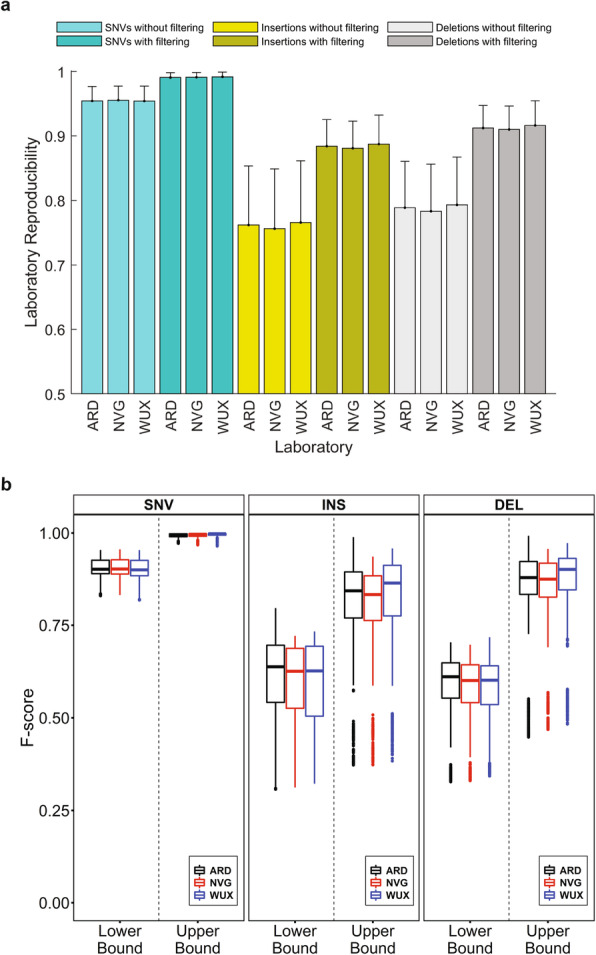
Fig. 4.

Lab reproducibility. a Lab reproducibility of the Chinese quartet samples in the original study. The bars represent average values of lab reproducibility and the error sticks indicate standard deviations. The x-axis ticks depict sequencing labs. The color legend represents variant types and HRR filtering status. b Boxplots of F-scores for SNVs (left panel), insertions (middle panel), and deletions (right panel). Results from the three labs are plotted in different colors: black for ARD (Annoroad), red for WUX (WuXi NextCODE), and blue for NVG (NovoGene). F-scores from the lower bound and upper bound of variants are separated and marked at x-axis
