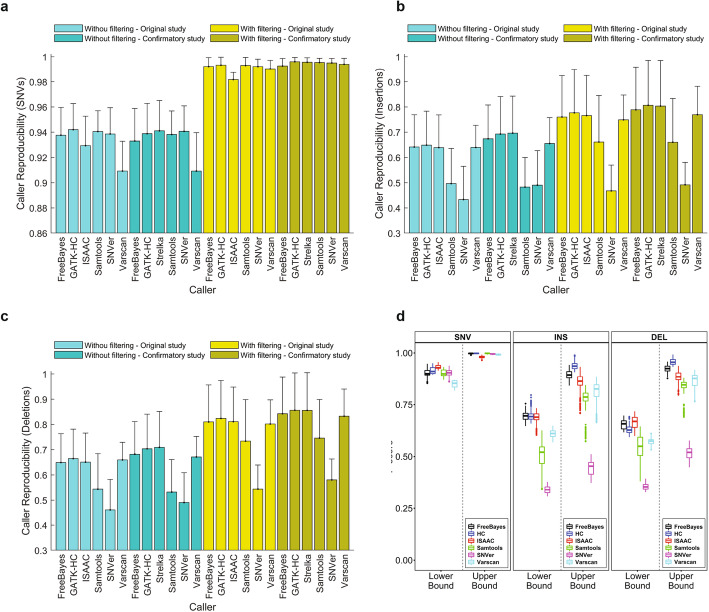
Fig. 6.
Caller reproducibility. a Caller reproducibility of SNVs. b Caller reproducibility of insertions. c Caller reproducibility of deletions. The bars represent average values of caller reproducibility for the six callers depicted at the x-axis ticks. The error sticks above the bars represent standard deviations. The color legend specifies if variants were filtered by HRR or not as well as data are from original or confirmatory studies. d Boxplots of F-scores for SNVs (left panel), insertions (middle panel), and deletions (right panel). Results from the six callers are plotted in different colors: black for FreeBayes, blue for HC, red for ISAAC, green for Samtools, magenta for SNVer, and cyan for VarScan. F-scores from the lower bound and upper bound of variants are separated and marked at the x-axis

