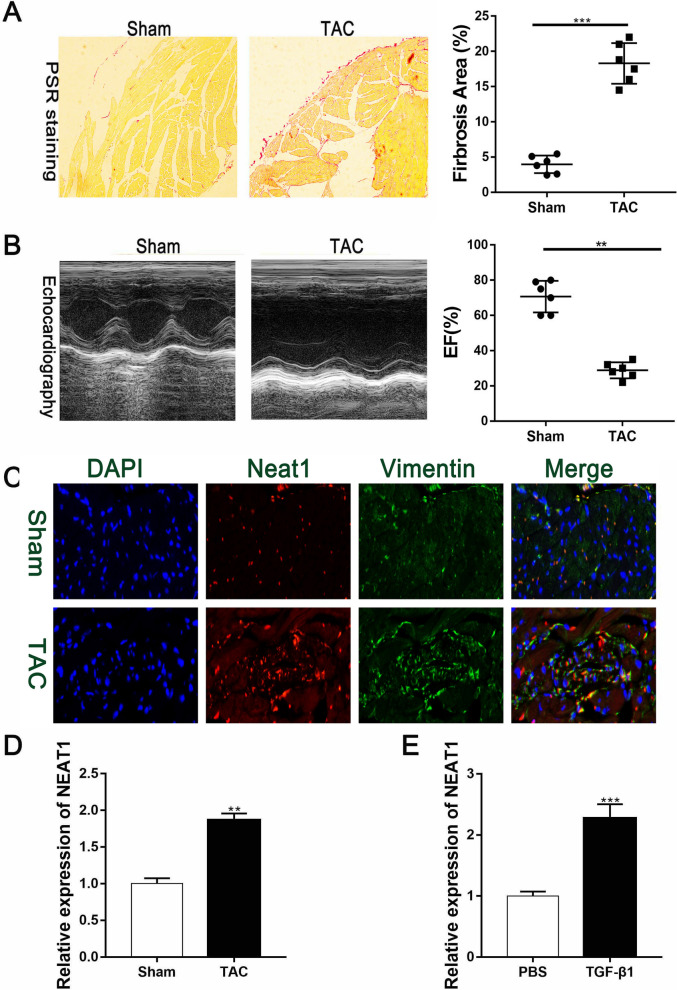
Fig. 2.
Upregulation of Neat1 in the left ventricular tissue of mice after TAC surgery. A Representative PSR staining results were presented and quantified to demonstrate the extent of cardiac fibrosis (n = 6 in each group). B Representative M-mode images of TAC and sham group mice and quantification of EF% via echocardiography (n = 6 in each group). C Representative immunofluorescence images and quantitative data for Neat1 expression in the left ventricles (n = 8 in the sham group and n = 10 in the TAC group; red, Neat1; green, vimentin; blue, DAPI; scale bar = 50 µm). D Expression of Neat1 according to qRT-PCR results in the sham group or TAC group (n = 6 in each group). E Expression of Neat1 in PBS-treated CFs or TGF-β1-treated CFs (n = 6 in each group). Data are presented as mean ± SEM. **p < 0.01, ***p < 0.001 for differences between the indicated groups

