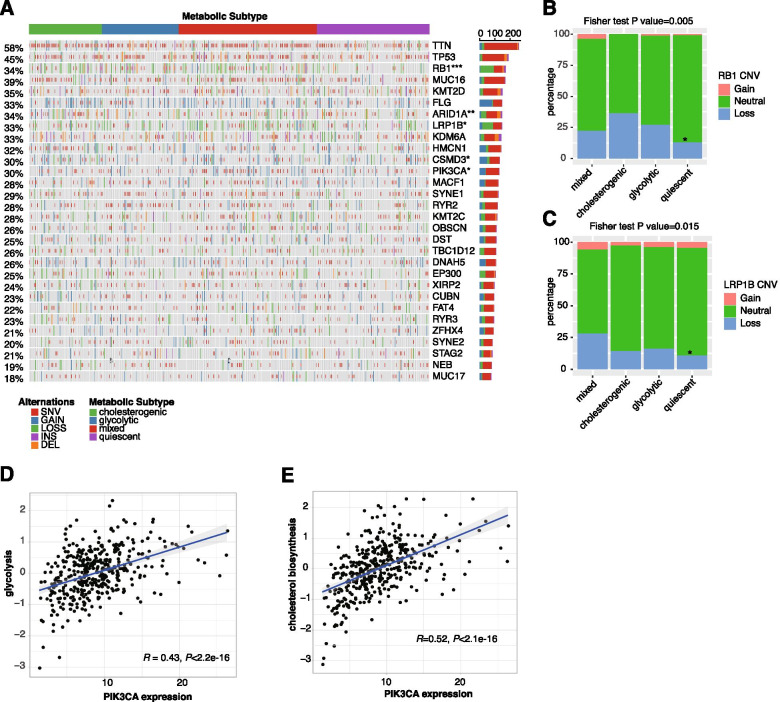
Fig. 4.
Mutational and CNV profiles of the 30 most frequently altered genes across the 4 metabolic subtypes of bladder cancer in the TCGA study. (A) Oncoprint illustrating the distribution of SNV/indel and CNV events affecting frequently altered genes in BCa across the 4 metabolic subtypes. Fisher exact test was performed to compare the frequencies of alteration across 4 subtypes. *P < 0.05; **P < 0.01;***P < 0.001; (B-C) Distribution of CNV alterations in RB1 and LRP1B. The Fisher exact test was used for comparison. * P < 0.05 compared to mixed subtype; (D-E) Scatter plot showing the correlation between PIK3CA expression and the median expression levels of the glycolytic and cholesterogenic genes

