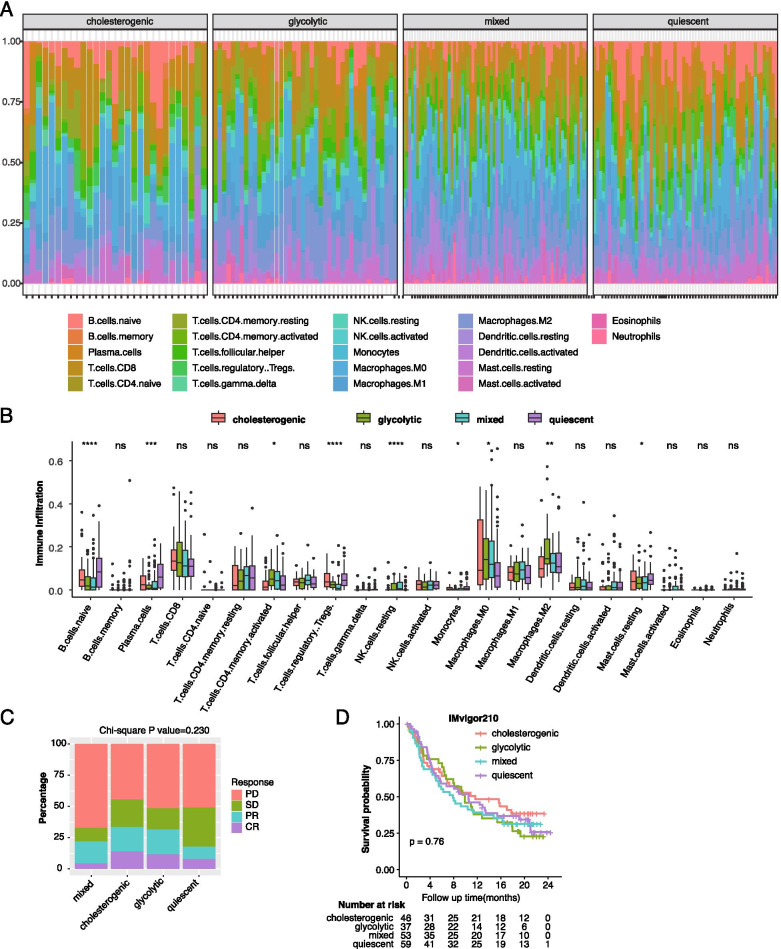
Fig. 6.
Immune cell infiltration and immunotherapy response across the bladder cancer metabolic subtypes. (A-B) Bar plot and histogram illustrating the distribution of 22 immune cell types estimated by CIBERSORT across the 4 metabolic subtypes. The Kruskal-Wallis test was used for comparison; (C) Immune-response rate according to metabolic subtypes in the IMvigor210 cohort; (D) Kaplan-Meier curves with log-rank test showing the overall survival of patients who received PD-L1 immunotherapy stratified by metabolic subtypes in the IMvigor210 cohort

