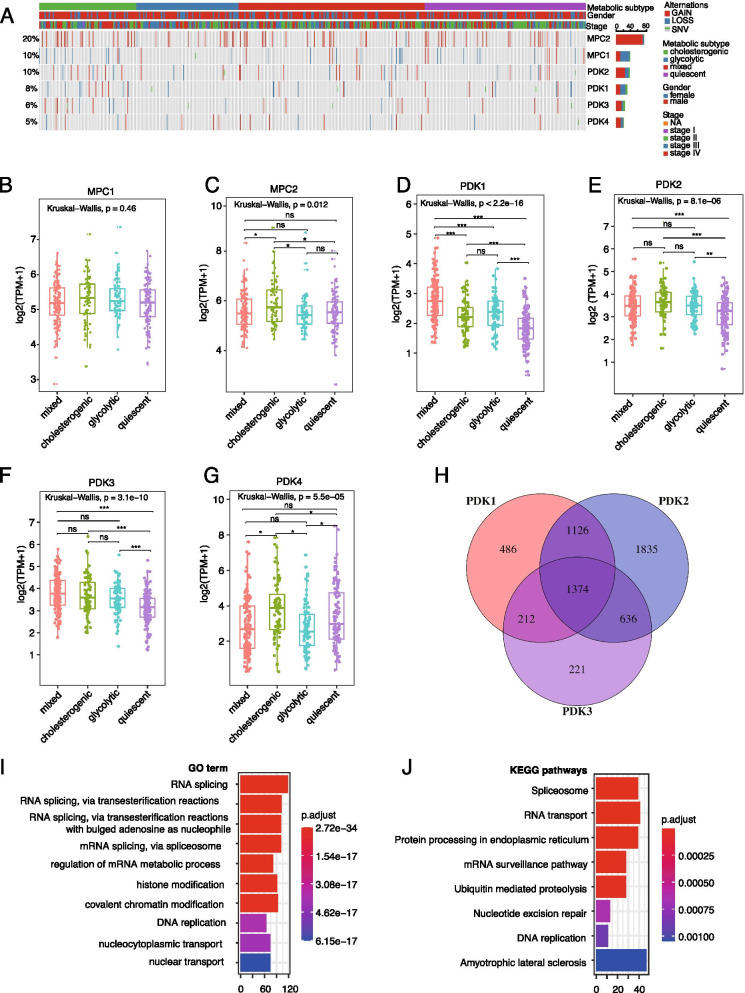
Fig. 7.
Association between MPC1/2 or PDK1-4 and bladder cancer metabolic subtypes. (A) The distribution of MPC1, MPC2, and PDK1-4 mutation and CNVs across the 4 metabolic subtypes in the TCGA study; (B-G) Expression levels of MPC1, MPC2, PDK1, PDK2, PDK3, and PDK4 across the 4 metabolic subtypes in TCGA cohort; (H) Veen diagram showing the number of genes significantly correlated with PDK1, PDK2, or PDK3 in the TCGA cohort (Pearson correlation |R| > 0.3 and P value< 0.001). All the common genes (n = 1374) were positively associated with PDK1, PDK2, and PDK3; (I-J) Top 10 most significantly enriched gene sets of GO terms and KEGG pathways associated with PDK1, PDK2, and PDK3 expression. Only genes significantly correlated with PDK1, PDK2, and PDK3 (n = 1374) were subjected to enrichment analysis.

