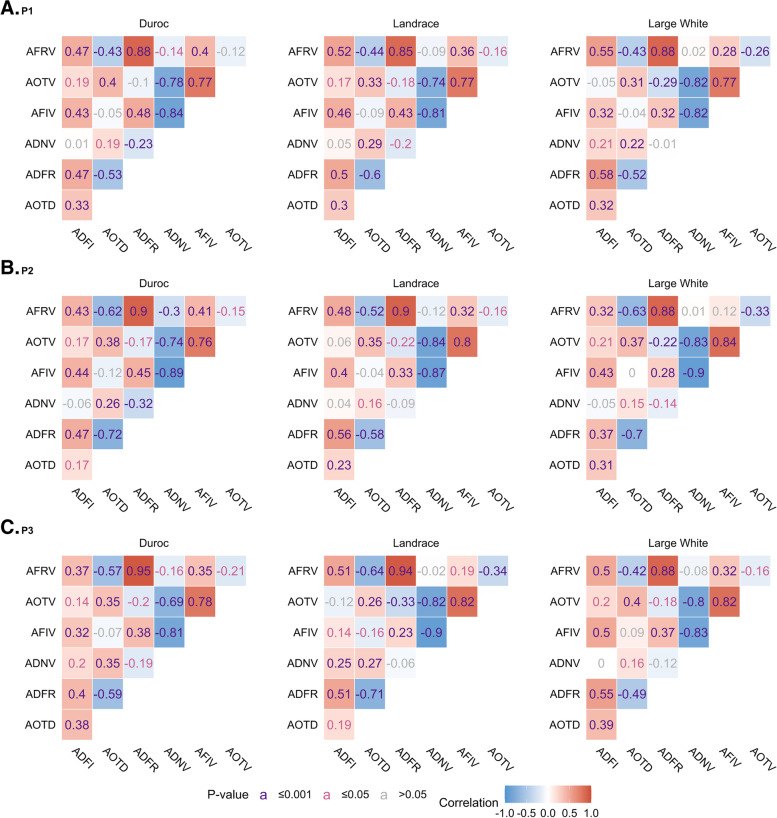
Fig. 1.
Spearman’s correlations of feeding behavior traits by breed during three periods. Correlations with P-value ≤ 0.001, ≤ 0.05, and > 0.05 are depicted in purple, pink, and grey, respectively. ADFI = average daily amount of feed consumed (g); AOTD = average daily feeder occupation time (s); ADFR = average daily feeding rate (g/min); ANVD = average daily number of visits to feeder; AFIV = average amount of feed consumed per visit (g); AOTV = average feeder occupation time per visit (s); AFRV = average feeding rate per visit (g/min). (A) Correlations of traits during P1; (B) Correlations of traits during P2; (C) Correlations of traits during P3

