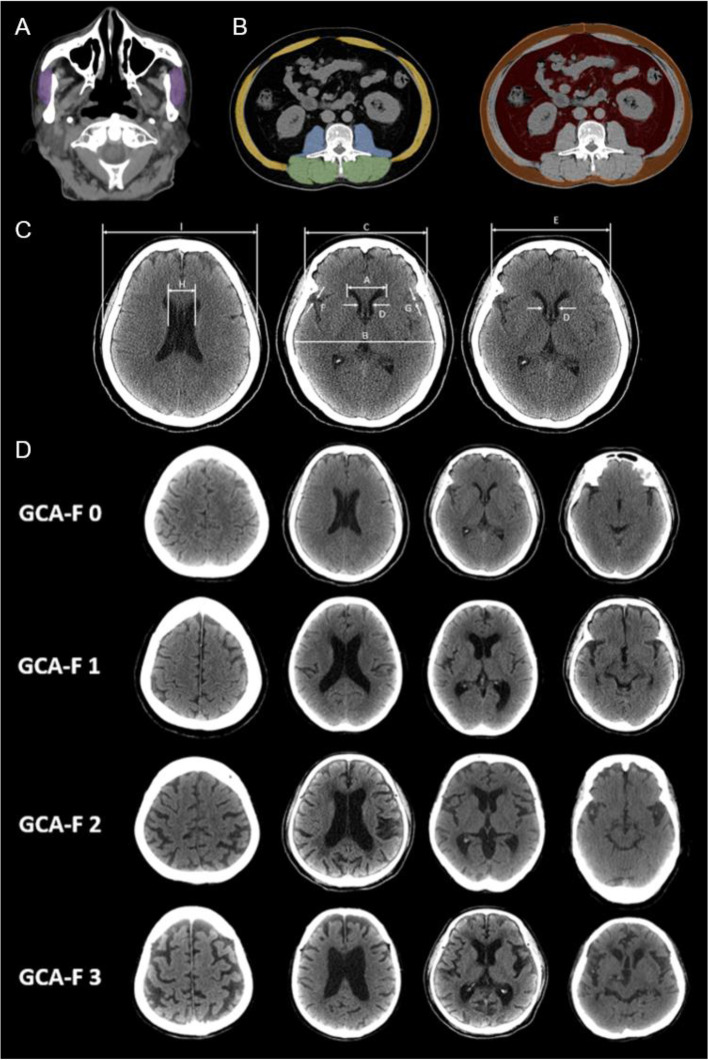
Fig. 1.
CT image analysis of body composition and brain atrophy. A. Head CT analysis of masseter muscle area. (Purple area: masseter muscle). B. Abdominal CT analysis of skeletal muscle area at third lumbar vertebral level. (Yellow area: abdominal wall muscle; Blue area: psoas muscle; Green area: paraspinal muscle; Orange area: subcutaneous adipose tissue; Red area: visceral adipose tissue). C. Measurements of brain atrophy parameters: A, B, C, D, E, F, G, H, I, in head CT images. Evans index (EI): ratio of maximum width of the frontal horns of the lateral ventricles (A) to the maximal internal diameter of the skull; Frontal horn index (FHI): ratio of the greatest external diameter of the frontal bone (C) to the greatest distance between the frontal horns at the same line (A); Bicaudate ratio (BCR): ratio of the maximum caudate nuclei distance (D) to distance between inner tables of skull at the same line (E); (B) at the same level; Sylvian fissure ratio (SFR): sum of bilateral width of the insular cisterns (in mm) (F)(G); Schiersmann index: ratio of the lateral ventricles greatest distance at the level of cella media (H) to distance between outer tables of skull (I) at the same line; Huckman number: sum of maximum width of the frontal horns of the lateral ventricles (in mm) (A) and the maximum caudate nuclei distance (in mm) (D). D. Examples of frontal cortical atrophy (F-GCA) scale. GCA 0: normal sulci and ventricle; GCA 1: slight widening of sulci with mild ventricular enlargement; GCA 2: gyral volume loss with moderate ventricular enlargement; GCA 3: pronounced widening of sulci with severe volume loss (knife blade atrophy) and severe ventricular enlargement

