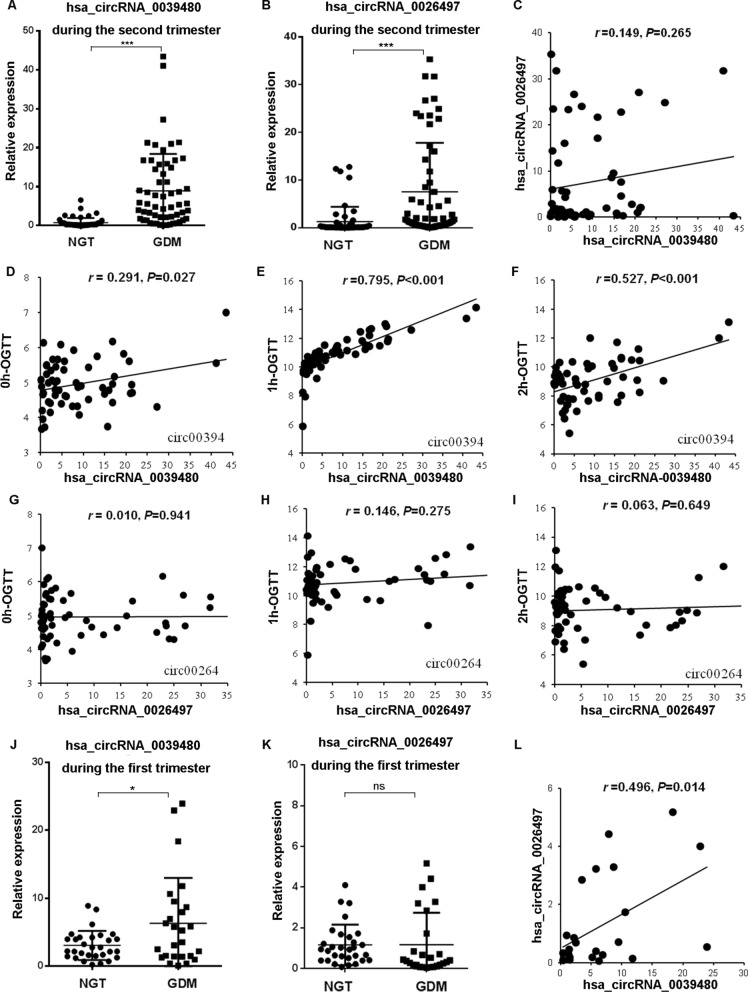
Fig. 4.
The expression of hsa_circRNA_0039480 and hsa_circRNA_0026497 in plasma exosomes of GDM/NGT pregnancy women during the first and second trimester and their correlation with OGTT glucose level. A and B the relative expression of hsa_circRNA_0039480 and hsa_circRNA_0026497 in GDM and NGT group for the second-trimester cohort. C the correlation between hsa_circRNA_0039480 and hsa_circRNA_0026497 expression in GDM group during the second trimester. D–F the correlation between hsa_circRNA_0039480 expression and OGTT level at 0, 1 h, and 2 h. G–I the correlation between hsa_circRNA_0026497 expression and OGTT level at 0, 1 h, and 2 h. J, K the relative expression of hsa_circRNA_0039480 and hsa_circRNA_0026497 in GDM and NGT group for the first-trimester cohort. L the correlation between hsa_circRNA_0039480 and hsa_circRNA_0026497 expression in GDM group during the first trimester. *P < 0.05, ***P < 0.001, ns, no significant difference

