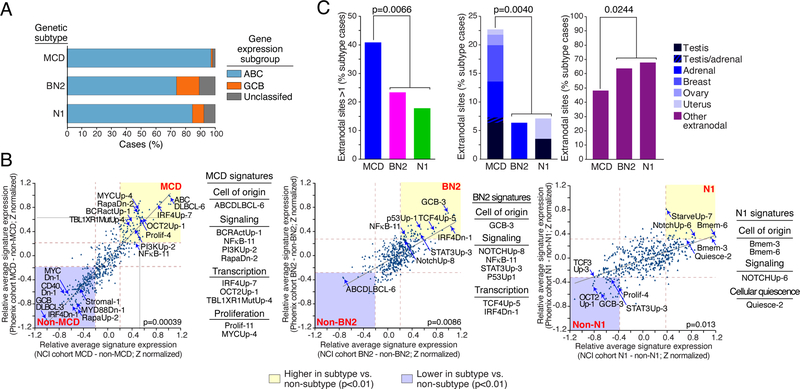
Figure 2.
Phenotypic and clinical characteristics of Phoenix genetic subtypes. A. Distribution of DLBCL gene expression subgroups among cases assigned to the MCD, BN2 and N1 genetic subtypes. B. Comparison of gene expression signature averages between genetic subtypes and all other DLBCL samples. Shown are Z scores (see Methods) representing the relative expression of each signature in a given subtype versus all other DLBCLs. Z scores calculated for the Phoenix and NCI cohorts are plotted on the y-axis and x-axis, respectively. The brown dashed lines indicate the Z scores corresponding to a significant difference between the two sample subsets (p=0.01). The yellow shaded areas include those signatures that are more highly expressed in the indicated subtype than in other samples and the blue shaded areas are signatures that are expressed at lower levels in the indicated subtype relative to other samples. The indicated p value is for the correlation of the Z scores from the two cohorts. C. Extranodal involvement in the genetic subtypes, subdivided by anatomic site as indicated. P values are from a 2-way Fisher’s Exact test. ns: non-significant.

