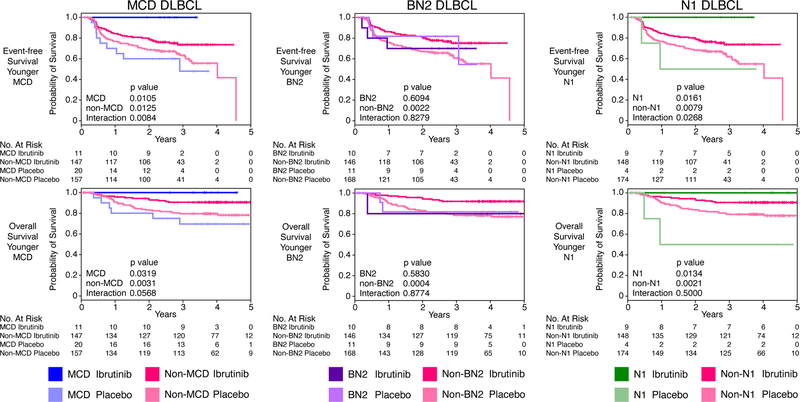
Figure 3.
Survival of Phoenix trial patients subdivided by genetic subtype and treatment arm. Shown are Kaplan-Meier plots of event-free and overall survival in younger (age ≤ 60) patients assigned to the MCD, BN2 and N1 genetic subtypes. Also shown are log-rank p values for the difference in survival in the indicated genetic subtype treated with R-CHOP plus ibrutinib or placebo. The interaction p values indicate the significance of the difference in ibrutinib benefit within the indicated genetic subtype compared with all other DLBCLs. “No. at risk” indicates the number of patients remaining without events (for event-free survival) or remaining alive (for overall survival.

