Fig. 1.
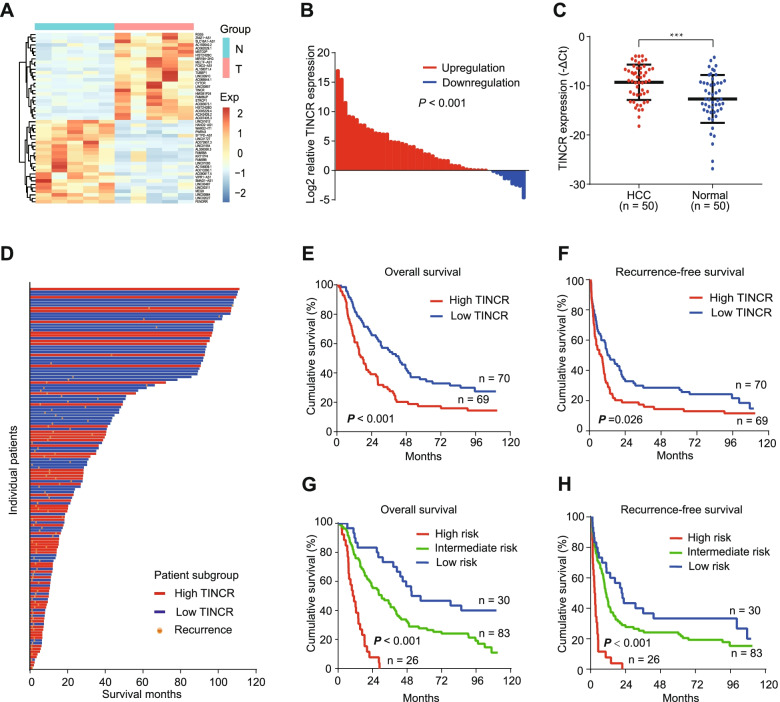
TINCR is upregulated in HCC and correlates with poor patient prognosis. A, Heat map of the most differentially expressed lncRNAs between five pairs of HCC and normal liver tissues (fold change > 2; P < 0.01). B, Expression of TINCR in HCC compared to that in normal liver tissues (50 pairs). C, Expression of TINCR in HCC (n = 50) and normal liver tissues (n = 50). Data represent the mean ± SEM. D, Waterfall plot of patients according to high or low TINCR expression. E-F, Kaplan–Meier analysis of overall (E) and recurrence-free (I) survival in high TINCR (n = 70) and low TINCR (n = 69) groups. G-H, Risk stratification of overall (G) and recurrence-free (H) survival based on the prognostic model integrating albumin-bilirubin grade, tumor size, macrovascular invasion, and TINCR expression. Low risk, score 0, n = 30; intermediate risk, score 1–2, n = 83; and high risk, score 4–5, n = 26. For (B) to (H), TINCR expression was measured using quantitative qRT-PCR. GAPDH was used as an internal control. ***P < 0.001

