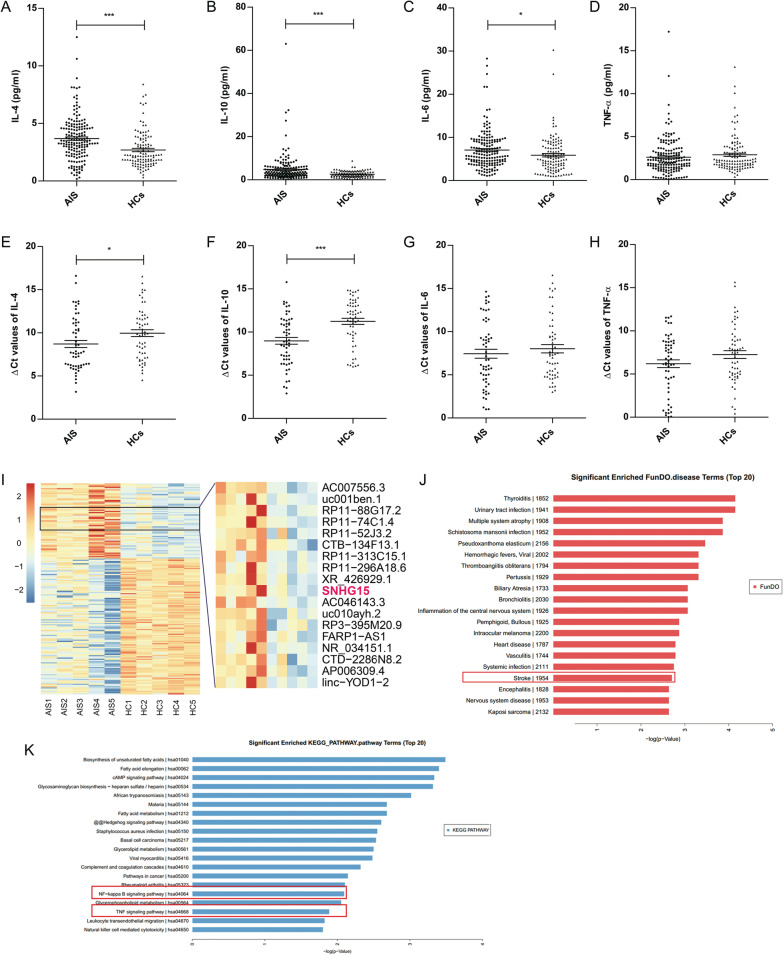
Fig. 1.
Differentially expressed cytokines and lncRNAs in AIS patients and HCs. Blood samples were collected within 48 h after onset of stroke and were subsequently isolated within 2 h. The levels of IL-4 (A), IL-10 (B), IL-6 (C), and TNF-α (D) in plasma were measured by a Navios flow cytometer. Expression of IL-4 (E), IL-10 (F), IL-6 (G), and TNF-α (H) was detected by qRT-PCR in PBMCs. I The heat map shows 70 upregulated and 128 downregulated lncRNAs in PBMCs identified by lncRNA microarray analysis. J Disease enrichment analysis showed the association of these lncRNAs with stroke. K Pathway enrichment analysis suggested the correlations of these lncRNAs with inflammatory pathways (NF-κB and TNF signaling pathways). * P < 0.05, *** P < 0.001

