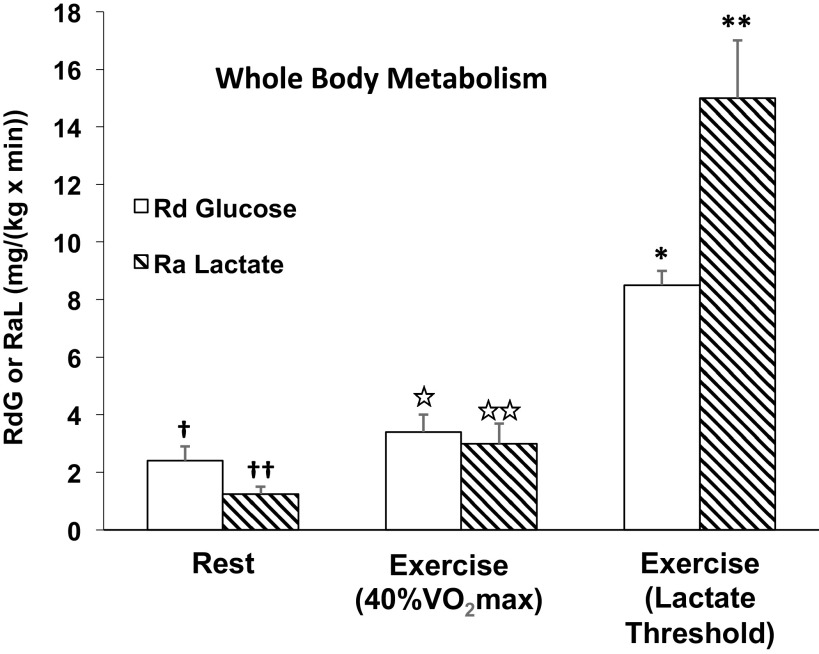
Figure 3.
Illustration of the relationships between whole body glucose rate of disappearance (Rd) and lactate appearance (Ra) in 10 men during rest, exercise at 40% V̇o2max (59), and lactate threshold (≈65% V̇o2max; 6 men) (38). Symbols: for rest glucose † and lactate †† fluxes significantly different from each other; for 40% V̇o2max exercise, glucose ⋆ and lactate ⋆⋆ fluxes not significantly different from each other, but increased from corresponding values at rest; for exercise at the LT glucose flux * significantly greater than that at rest and 40% V̇o2max, and lactate flux ** significantly greater than corresponding values at rest, 40% V̇o2max and the corresponding glucose flux. Lactate flux in excess of glucose flux is attributable to the contribution of glycogenolysis to glycolytic carbon flux (18).

