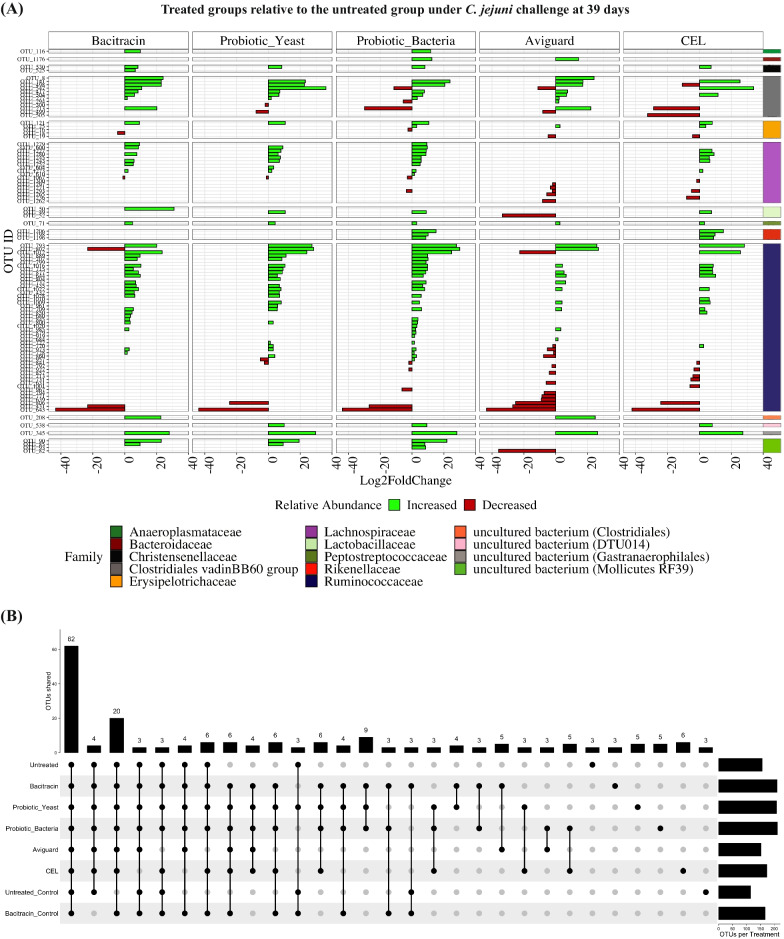
Fig. 4.
Changes in abundance of OTUs across treatments. A Logarithmic fold changes of differential OTUs from differential abundance analyses with DESeq2 at 39 days post-hatch, comparing treated groups to the untreated group under C. jejuni challenge. OTUs that are in significantly greater or lesser abundance are represented in green and red coloured bars respectively. OTUs are further grouped by their assigned taxonomic families. Legend lists taxonomic families in order of appearance B Vertical bars in the UpSet plot visualizes the number of OTUs unique to each treatment group and the number of OTUs shared between treatment groups at 39 days post-hatch. Horizontal bars represent the total number of OTUs found in each treatment group

