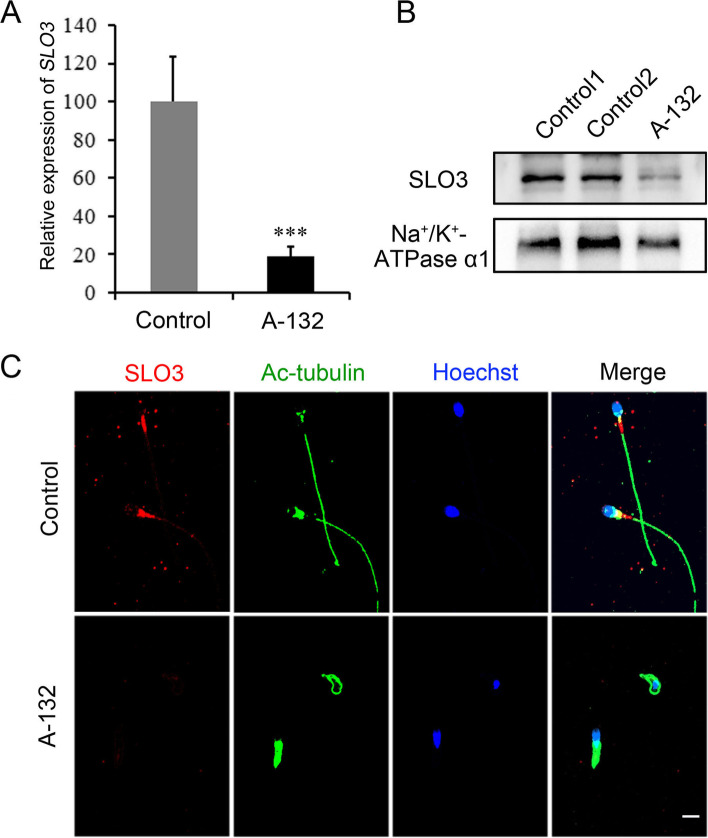
Fig. 3.
Expression analysis of SLO3 mRNA and protein and localization of the SLO3 protein in sperm flagella. A Quantitative real-time PCR analysis of the expression of SLO3 mRNA in the spermatozoa from normal control and the SLO3-mutated individual. Compared with control, the expression of SLO3 mRNA is significantly reduced in the sperm from the SLO3-mutated individual. β-actin was used as an internal control. Data are presented as the mean ± SEM. ***P < 0.001; Student’s t-test. B Immunoblotting of sperm lysates from a normal control and the SLO3-mutated individual using an anti-SLO3 antibody. Na+/K+-ATPase α1 was used as loading control. C Representative images of spermatozoa from controls and from the SLO3-mutated individual stained with anti-SLO3 antibody, anti-Ac-tubulin antibody, and Hoechst. SLO3 staining is concentrated at the mid-piece of sperm flagella and faintly along the flagella in the fertile control but is significantly reduced in the sperm flagella of the individual harbouring the SLO3 mutation. Scale bar, 20 μm

