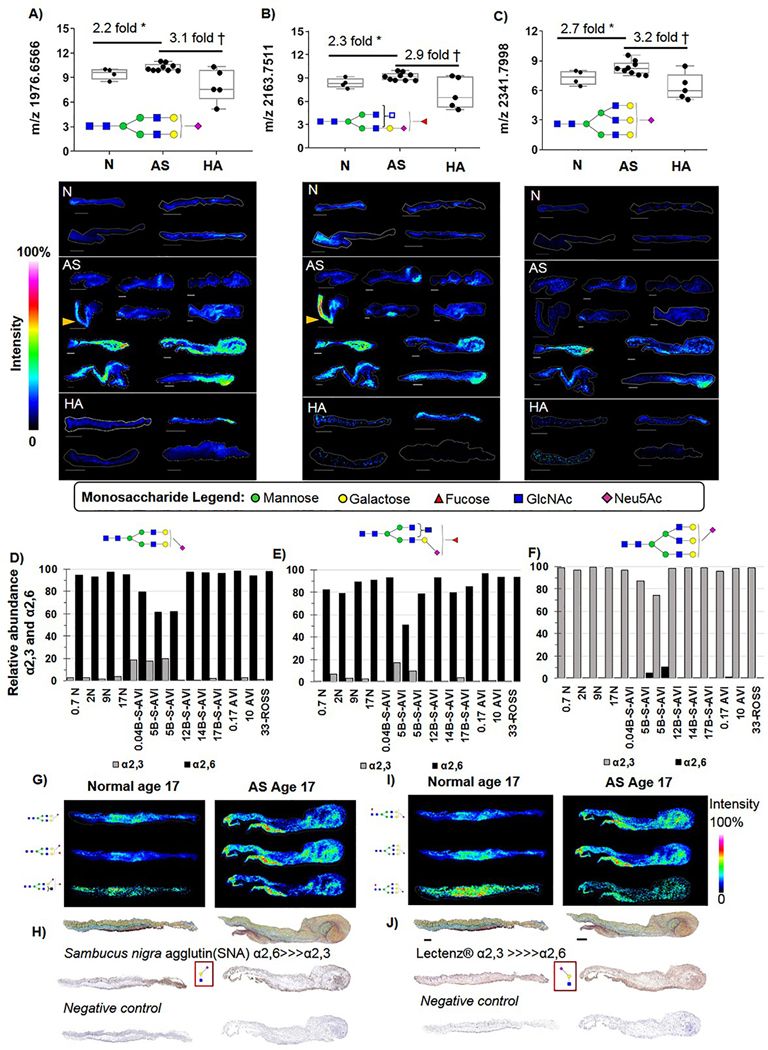
Figure 6. On-tissue measurements of specific Neu5Ac containing N-glycans with consistent elevation in AS expression levels independent of age.
A) Bi-antennary Neu5Ac m/z 1976 is elevated 2.2 fold in AS tissues. Localization is to collagenous regions of the leaflet. B) Putative tri-antennary Neu5Ac m/z 2163 elevated 2.3 fold in AS. A&B) Yellow arrow points to differential spatial expression in aorta versus leaflet, no tused in quantification. C) Tri-antennary Neu5Ac m/z 2341 elevated 2.7 fold in AS. D-F) Linkage analysis of target N-glycans by on-tissue chemical derivatization. The m/z 1976 and 2163 are primarily α2,6 linked while m/z 2341 is primarily α2,3 linked. G) Example image patterns for select α2,6 linked-glycans. H) Lectin staining for the α2,6 NeuAc-galactose-GlcNac motif. I) Example image patterns for select α2,3 linked-glycans. J) Lectin staining for the α2,3 NeuAc-galactose-GlcNac motif. * Two tailed student’s t-test p-value ≤0.05; † p-value ≤0.001. Bar= 300 μm.

