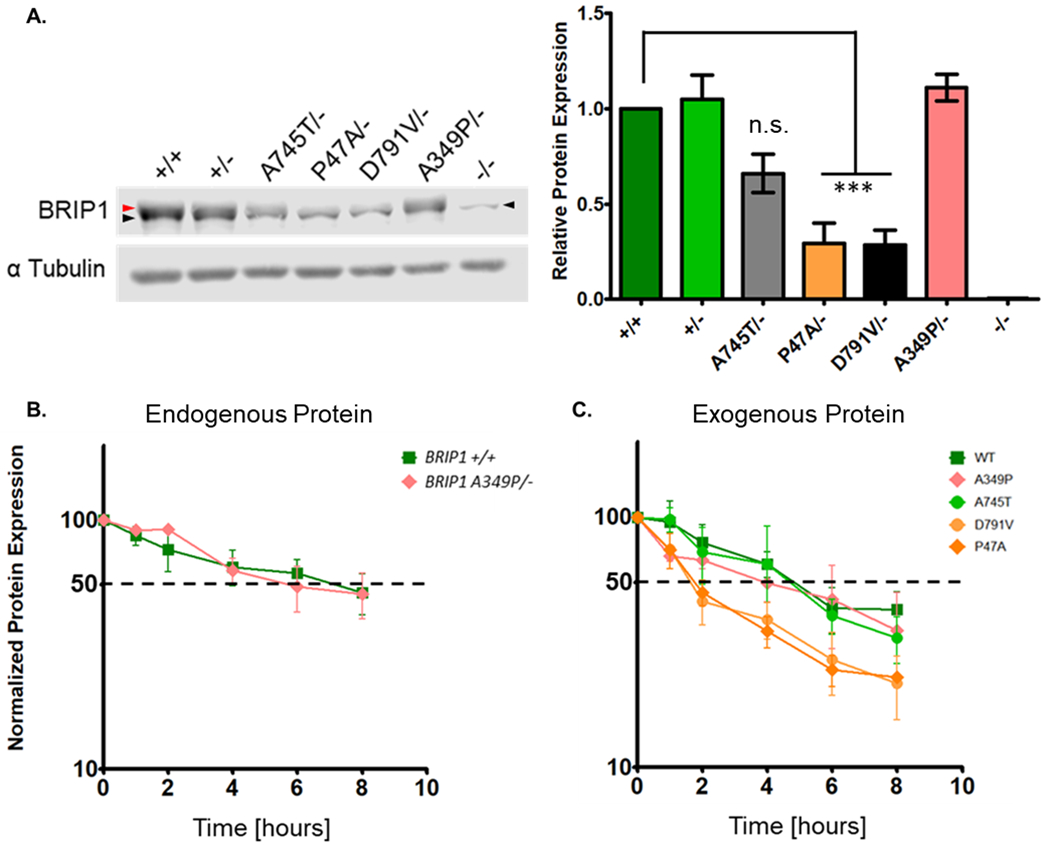
Figure 4. BRIP1 hypomorphs exhibit protein instability.

A) Representative western blot showing variable protein expression in HeLa clones (red arrowhead denotes BRIP1 protein; black arrow head denotes non-specific band of lower mass). Right panel: Quantification of relative BRIP1 levels. Data presented are the average of three replicates with error bars indicating one standard deviation. Statistical significance determined by one way ANOVA with a Dunnett’s multiple comparison test to BRIP1+/+ (*** p<0.0001). B) Cycloheximide chase analysis of endogenous wildtype and A349P protein. Fifty percent protein expression denoted by dotted black line. Data presented are the average of three replicates with error bars indicating one standard deviation. C) Cycloheximdie chase analysis of exogenously expressed wildtype, A349P, A745T, D791V and P47A protein. Half-life denoted by dotted black line. Data presented are the average of three replicates with error bars indicating one standard deviation.
