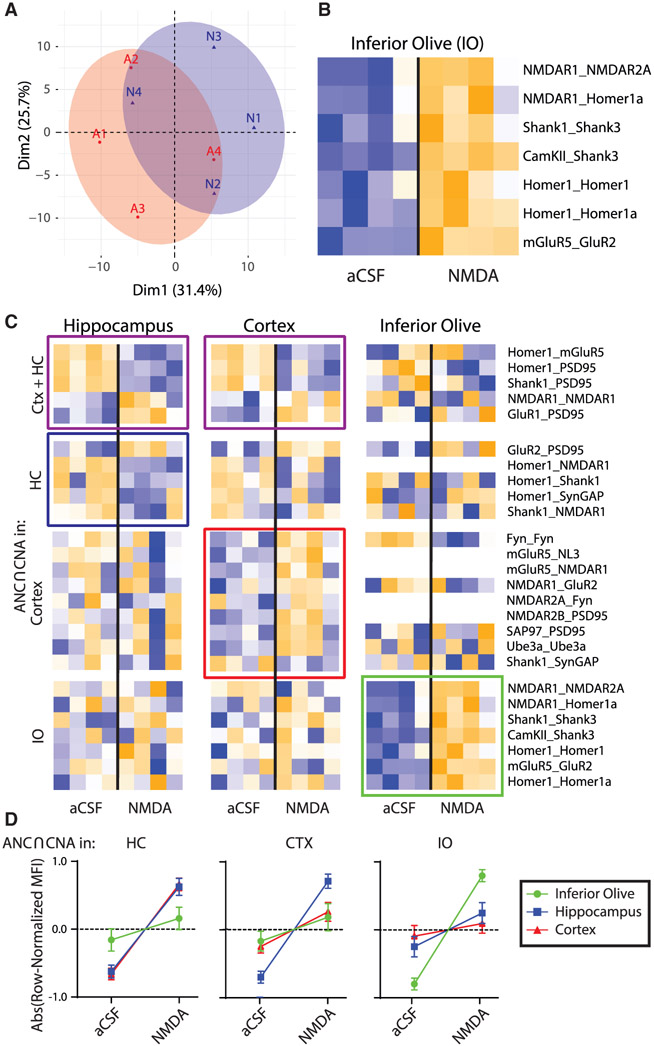
Figure 4. Effects of NMDA stimulation on the ex vivo IO as compared to CTX and HC.
(A) PCA of aCSF (A, red) and NMDA (N, blue) groups for the IO. Each point represents a biological replicate, N = 8.
(B) Heatmap of all PiSCES that are ANC∩CNA significant for the NMDA versus aCSF comparison for the IO, meaning they are significant by the ANC statistical test for a comparison between ACSF versus NMDA in the IO and belong to a CNA module that is significantly correlated with NMDA treatment.
(C) Heatmaps of all PiSCES that were ANC∩CNA significant for the NMDA versus aCSF comparison in CTX, HC, and IO (CTX and HC data are identical to that in Figure 3). The heatmap is row-normalized separately for each brain region to highlight overall PiSCES behavior while ignoring baseline differences in protein expression. Boxes indicate PiSCES that are ANC∩CNA significant for that brain region: purple boxes indicate significant for both CTX and HC, blue indicates HC, red indicates CTX, and green indicates IO. Although there is overlap in the PiSCES activated by NMDA in HC and CTX, the response in IO is unique.
(D) For each brain area, the averaged normalized MFI value of all PiSCES that were ANC∩CNA significant in that brain area are shown for all other brain areas. For example, the left graph shows PiSCES that significant in the HC also showed similar behavior in CTX, but not in the IO. Conversely, PiSCES that were significant in the IO (right graph) did not change in CTX nor in HC.

