. 2021 Jul 12;20(10):1820–1835. doi: 10.1158/1535-7163.MCT-21-0013

Figure 1.

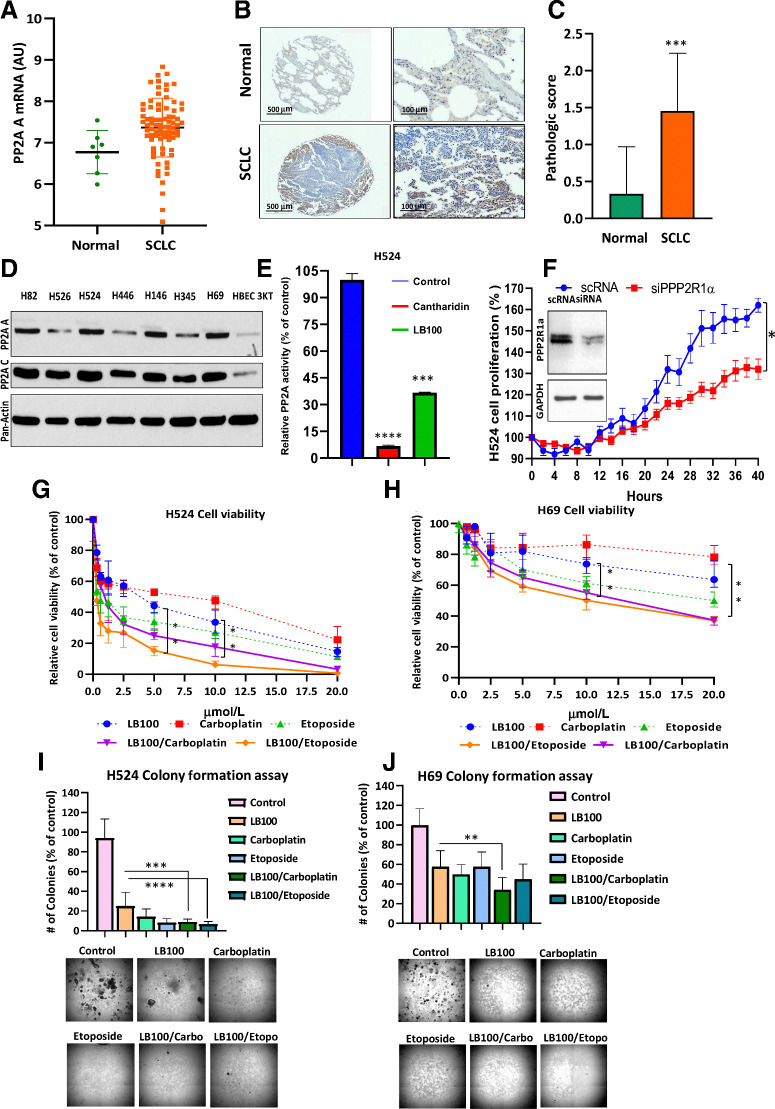
Figure 1. PP2A A expression in SCLC tumors and cells, effect LB100. A, Scatter plot shows an upregulation of the PP2A-A subunit in the tumor samples (P = 0.0144). A Mann–Whitney U test was used for comparison between the normal and SCLC samples. B, IHC for PP2A was conducted on TMA tissue sections, and images were captured at 4× or 20× using a 3D-Histech PANNORAMIC SCAN whole slide scanner (3D-Histech). PP2A subunit A positively immunostained the cytoplasm and nucleus of normal lung and tumor tissue but was highly upregulated in tumor tissue. TMAs were scored in normal (n = 24) and tumor (n = 79) cores on a scale from 0 (no staining/no protein expression) to 3+ (strong staining/high protein expression). C, Summary bar graph of the average PP2A subunit staining. IHC staining intensity of normal and tumor cores. There was a statistically significant difference between normal and tumor tissue (***, P < 0.001). Student t test was used for comparison between the normal and SCLC samples. D, To compare the expression of PP2A subunits A and C, cell lysates from seven SCLC cell lines and HBEC 3KT (nonmalignant cell line) were subjected to Western blotting (n = 3 biological replicates). E, PP2A activity was determined using a serine/threonine phosphatase activity assay (Millipore) after 24 hours exposure to cantharidin (10 μmol/L) and LB100 (5 μmol/L; n = 3 biological replicates).***, P < 0.001, results were analyzed by ANOVA with Tukey post-test. F, The inset showed reduction of PP2A subunit Aα in H524 cells as well as inhibition of cell proliferation due to PP2A subunit Aα knockdown (n = 3 biological replicates). P < 0.05, Student t test was used for comparison between the groups. LB100 alone or in combination with carboplatin inhibited proliferation and colony formation in SCLC cells. The Cell Counting Kit-8 assay detected cell H524 and H69 cell viability. (n = 3 biological replicates). G and H, Cells were treated with LB100, carboplatin and etoposide, as a single treatment or in combination, at constant ratio. The CI was calculated using Chou-Talalay method to find synergism between LB100 with carboplatin and etoposide (CompuSyn software: www.combosyn.com). **, P < 0.01, ANOVA with Tukey post test was used for comparison between LB100, LB100/carboplatin, and LB100/etoposide. Colony formation assays were used to count the ability of H524 (I) and H69 (J) cells to form colonies. Drug concentrations are listed for two assays with H524 and H69, respectively: LB100 (2.5 μmol/L; 20 μmol/L), carboplatin (4 μmol/L; 20 μmol/L), etoposide (3 μmol/L; 30 μmol/L), LB100/carboplatin (2.5 and 4 μmol/L; 20 and 20 μmol/L), and LB100/etoposide (2.5 and 3 μmol/L; 20 and 30 μmol/L). Representative images of colonies at 4× are shown under the graph (n = 2). *, P < 0.05; **, P < 0.01; ***, P < 0.001; ****, P < 0.0001. Results were analyzed by ANOVA with Tukey post test.

PP2A A expression in SCLC tumors and cells, effect LB100. A, Scatter plot shows an upregulation of the PP2A-A subunit in the tumor samples (P = 0.0144). A Mann–Whitney U test was used for comparison between the normal and SCLC samples. B, IHC for PP2A was conducted on TMA tissue sections, and images were captured at 4× or 20× using a 3D-Histech PANNORAMIC SCAN whole slide scanner (3D-Histech). PP2A subunit A positively immunostained the cytoplasm and nucleus of normal lung and tumor tissue but was highly upregulated in tumor tissue. TMAs were scored in normal (n = 24) and tumor (n = 79) cores on a scale from 0 (no staining/no protein expression) to 3+ (strong staining/high protein expression). C, Summary bar graph of the average PP2A subunit staining. IHC staining intensity of normal and tumor cores. There was a statistically significant difference between normal and tumor tissue (***, P < 0.001). Student t test was used for comparison between the normal and SCLC samples. D, To compare the expression of PP2A subunits A and C, cell lysates from seven SCLC cell lines and HBEC 3KT (nonmalignant cell line) were subjected to Western blotting (n = 3 biological replicates). E, PP2A activity was determined using a serine/threonine phosphatase activity assay (Millipore) after 24 hours exposure to cantharidin (10 μmol/L) and LB100 (5 μmol/L; n = 3 biological replicates).***, P < 0.001, results were analyzed by ANOVA with Tukey post-test. F, The inset showed reduction of PP2A subunit Aα in H524 cells as well as inhibition of cell proliferation due to PP2A subunit Aα knockdown (n = 3 biological replicates). P < 0.05, Student t test was used for comparison between the groups. LB100 alone or in combination with carboplatin inhibited proliferation and colony formation in SCLC cells. The Cell Counting Kit-8 assay detected cell H524 and H69 cell viability. (n = 3 biological replicates). G and H, Cells were treated with LB100, carboplatin and etoposide, as a single treatment or in combination, at constant ratio. The CI was calculated using Chou-Talalay method to find synergism between LB100 with carboplatin and etoposide (CompuSyn software: www.combosyn.com). **, P < 0.01, ANOVA with Tukey post test was used for comparison between LB100, LB100/carboplatin, and LB100/etoposide. Colony formation assays were used to count the ability of H524 (I) and H69 (J) cells to form colonies. Drug concentrations are listed for two assays with H524 and H69, respectively: LB100 (2.5 μmol/L; 20 μmol/L), carboplatin (4 μmol/L; 20 μmol/L), etoposide (3 μmol/L; 30 μmol/L), LB100/carboplatin (2.5 and 4 μmol/L; 20 and 20 μmol/L), and LB100/etoposide (2.5 and 3 μmol/L; 20 and 30 μmol/L). Representative images of colonies at 4× are shown under the graph (n = 2). *, P < 0.05; **, P < 0.01; ***, P < 0.001; ****, P < 0.0001. Results were analyzed by ANOVA with Tukey post test.