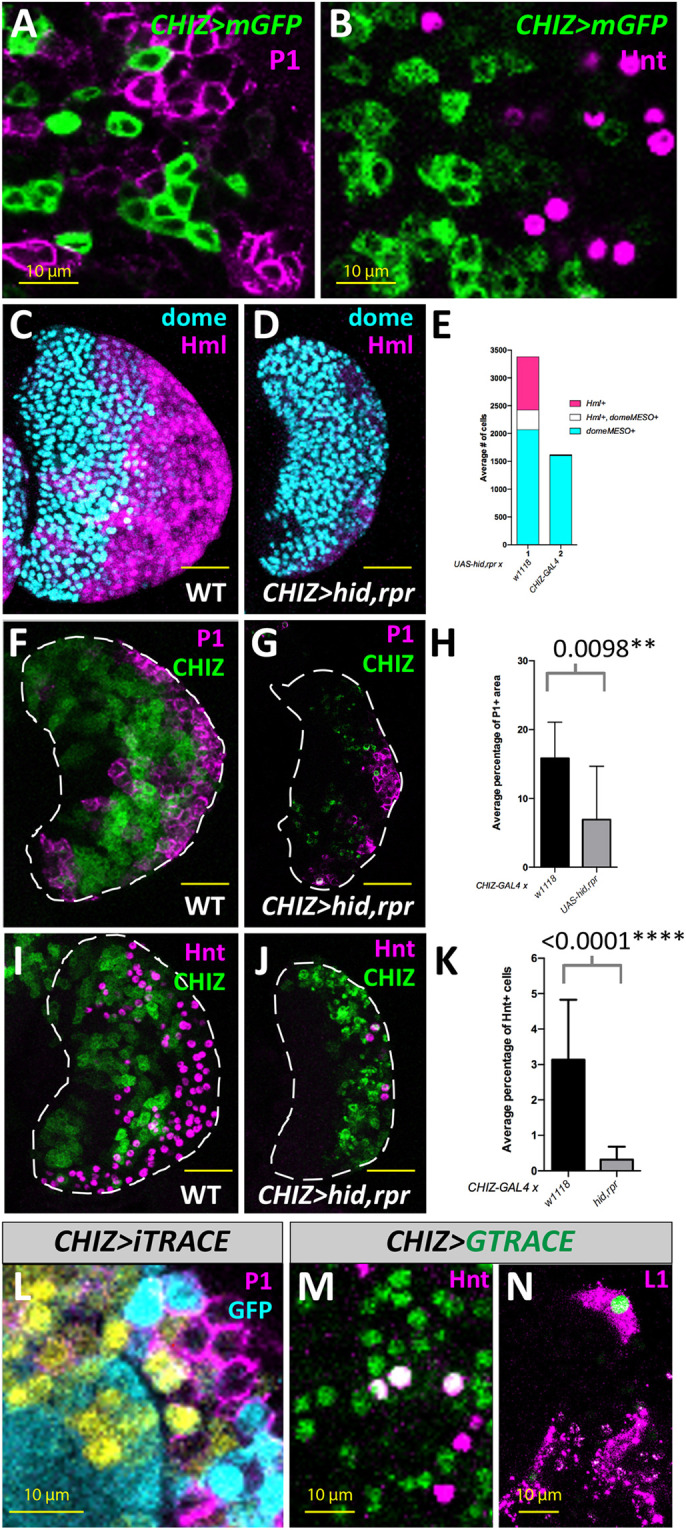
Fig. 2.

IP cells contribute to all mature hemocyte populations. (A) CHIZ cells (green) do not colocalize with mature plasmatocytes which stain for P1 (magenta). Instead, CHIZ cells are often seen neighboring P1-expressing cells. (B) CHIZ cells (green) do not stain for Hnt (magenta), a marker for crystal cells. (C) A control primary lobe without any GAL4 driver shows dome+ MZ cells (cyan) and Hml+ CZ cells (magenta) (domeMESO-BFP, HmlΔ-DsRed, UAS-hid,rpr). (D) Apoptosis induced in the IP population leads to a severe decrease in the Hml+ (magenta) population compared with dome+ (cyan) (domeMESO-BFP, HmlΔ-DsRed; CHIZ-GAL4, UAS-hid,rpr). (E) Quantitation of data shown in C and D. n=10 LGs for the control and n=8 LGs for CHIZ>hid,rpr. (F) Control showing non-overlap of CHIZ cells (green) and P1-expressing cells (magenta) (CHIZ>mGFP). (G) Genetic ablation of IP cells (green) leads to a reduction in P1-expressing cells (magenta). Dying CHIZ cells are evident as GFP puncta (green, also seen in J) (CHIZ>mGFP, UAS-hid,rpr). (H) Quantitation of data shown in F and G. n=17 LGs for the control and n=14 LGs for CHIZ>hid, rpr. (I) Control number of Hnt-expressing crystal cells (CHIZ>mGFP). (J) IP ablation leads to a reduction in crystal cell number (Hnt+, magenta) (CHIZ>mGFP, UAS-hid, rpr). (K) Quantitation of data shown in I and J. n=14 LGs for the control and n=11 LGs for CHIZ>hid, rpr. (L) CHIZ cell descendants [identified by the lack of GFP expression (cyan)] are observed to have P1 antibody staining (magenta). Live expression of CHIZ-GAL4 is visualized in yellow (CHIZ-GAL4; UAS-iTRACE). (M) Crystal cells marked by Hnt antibody staining (magenta) can colocalize (white, due to overlap of green and magenta) with cells lineage traced from the CHIZ population (green) (CHIZ-GAL4, UAS-GTRACELTO). (N) Cells lineage traced from the CHIZ population (green) can be seen expressing L1 (magenta) present in mature lamellocytes (CHIZ-GAL4; UAS-GTRACELTO) 24 h post-injury induced at the late second instar. For LGs shown in panels L-N, lineage tracing was initiated at the mid-second instar coincident with the first appearance of CHIZ-GAL4+ cells and LGs were dissected at the wandering third instar. A and B are single slices from a z-stack, L is a maximum projection stack of 10 slices, M and N are maximum projection of three slices, and C,D,F,G,I and J are stacks of the middle third of confocal data. White dashed lines indicate the edges of LG primary lobe in F,G,I and J. Data are mean±s.d. Unpaired two-tailed Student's t-test. Scale bars: 25 μm (C-D,F-G,I-J); 10 μm (A-B,L-N).
