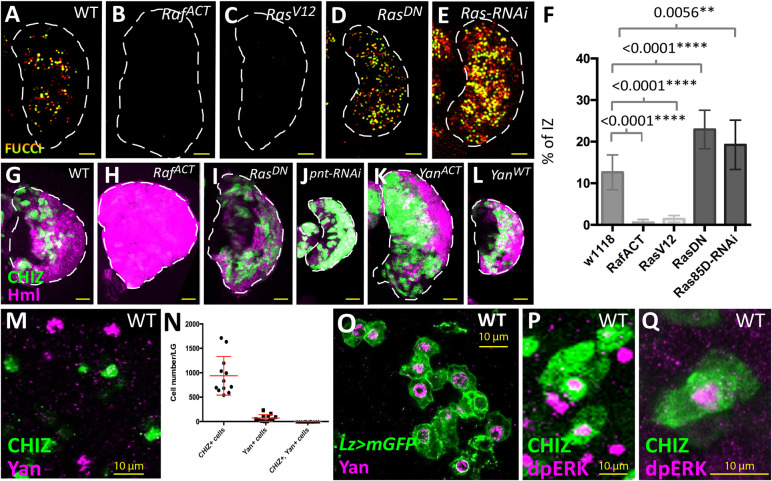
Fig. 3.
Ras/Raf activity facilitates the IP-to-hemocyte transition. (A-E) CHIZ+ IZ cells are marked with a nuclear fluorescent marker for quantification purposes (CHIZ-GAL4, UAS-FUCCI, UAS-X, where X is defined for each panel). (A) Control number of IZ cells. (B) UAS-RafACT leads to a loss of IZ cells. (C) UAS-RasV12 causes a similar decrease in IZ cells as B. (D) An increase in IZ cells is apparent when CHIZ-GAL4 drives UAS-RasDN. (E) Increased IZ cells are present when expressing UAS-Ras85D-RNAi in IZ cells. (F) Fraction of CHIZ+ cells in LGs represented in A-E. Data are mean±s.d. n=11, n=14, n=14, n=12 and n=12 LGs for each dataset in sequence, respectively. Unpaired two-tailed Student's t-test. (G-L) CHIZ+ IZ cells are marked in green and Hml+ CZ cells are labeled in magenta (CHIZ-GAL4, UAS-mGFP; HmlΔ-DsRed; UAS-X, where X is defined for each panel). (G) Wild type. (H) UAS-RafACT causes an extreme expansion of the CZ and loss of IZ. (I) UAS-RasDN increases the proportion of IZ cells and leads to a decrease in CZ cells. (J) UAS-pnt-RNAi causes a large increase in proportion of IZ cells and very few CZ cells. (K) UAS-YanACT causes an increased IZ and reduced CZ. (L) UAS-YanWT does not result in a shift in the general proportion of IZ to CZ as seen in K. Images of LGs in A-E and G-L are maximum projections of the middle third of a Z-stack. (M) IZ cells (green) do not directly colocalize with nuclear Yan protein (magenta) (CHIZ>dsGFP). (N) Data from CHIZ>dsGFP LGs showing lack of any significant overlap between CHIZ+ and Yan+ cells. n=12 LGs. (O) Crystal cells (green) express nuclear Yan protein (magenta) (Lz-GAL4, UAS-mGFP). (P,Q) A subset of IZ cells (green) shows nuclear dpERK staining (magenta) (CHIZ>mGFP). Panels M,O,P and Q are maximum projection stacks of three slices of a z-stack. Data are mean±s.d. Unpaired two-tailed Student's t-test. Scale bars: 25 μm (A-E,G-L); 10 μm (M,O-Q).

