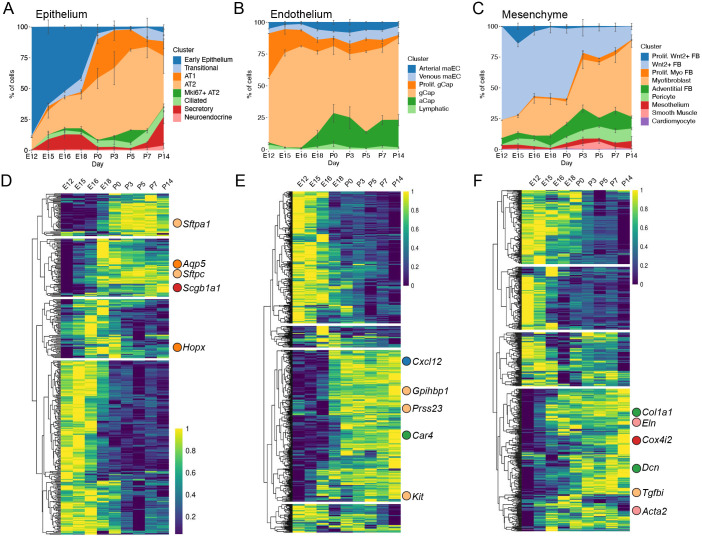
Fig. 2.
Cell populations in the lung change markedly over time. (A-C) Relative proportion of cell types as a function of time, as detected by scRNA-seq, in epithelium (A), endothelium (B) and mesenchyme (C). Error bars indicate standard error of the mean from at least four mice from each time point after E12. (D-F) Genes in epithelial cells (D) with statistically significant expression changes as a function of time (q<0.05) by Monocle3 analysis are plotted in a heatmap. Gene expression was log transformed and normalized from 0 to 1 and arranged using hierarchical clustering before plotting. Saturation shading of yellow to blue: high to low expression-level spectrum. Expression patterns were separated into four groups (k=4). When hallmark genes (Fig. 1D) were included in the heatmap, their location is indicated, with matching color to stacked area plots and UMAP above. Genes without statistically significant expression changes over time are not indicated. Similar analysis was performed for the endothelial cells (E) and the mesenchymal cells (F).

