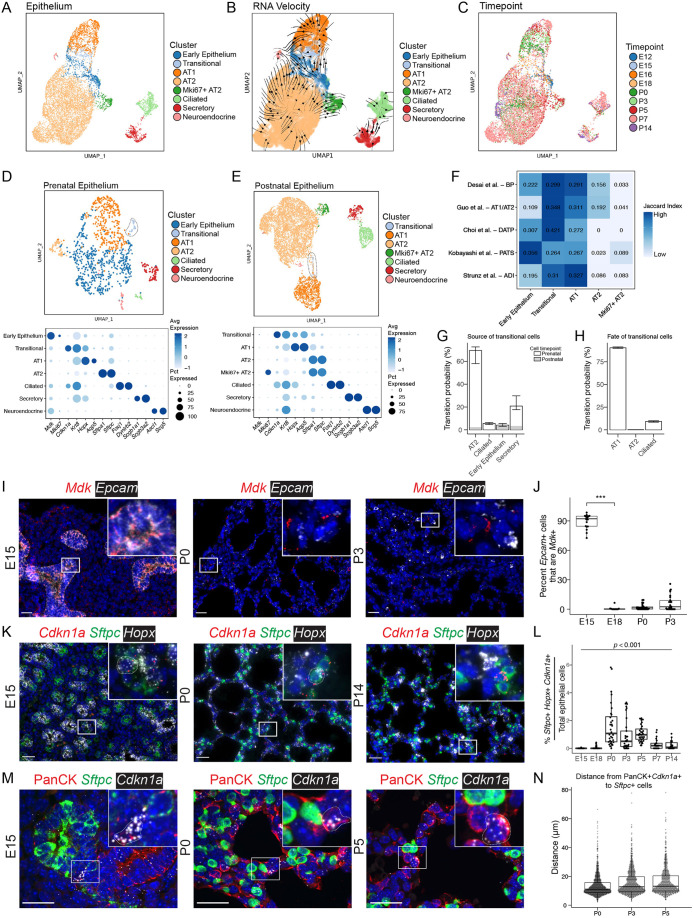
Fig. 3.
Distinct epithelial cell identities are established by E18. (A) UMAP embedding of lung epithelial cells (n=10,918) colored by cell type. Although epithelial cells from early lungs (E12 and E15) do occupy distinct UMAP space (‘early epithelium’), their broad spread is consistent with substantial heterogeneity and priming towards several nascent lineages. (B) RNA-velocity vectors were calculated using CellRank and overlaid on the UMAP embedding, with line thickness indicating velocity magnitude. (C) UMAP embedding colored by time point. (D) Epithelial cells from prenatal time points (E12, E15, E16 and E18) are projected on a UMAP and colored by cell type. The transitional epithelial cell cluster is circled in a dotted line. Marker gene expression by cluster in the prenatal epithelium is displayed in a dot plot (below), in which higher expression is represented as a darker color. The size of the dot indicates the proportion of cells expressing that marker. (E) Epithelial cells from postnatal time points (P0, P3, P5, P7 and P14) are projected on a UMAP and colored by cell type. The transitional epithelial cell cluster is encircled in a dotted line. Marker gene expression by cluster in the postnatal epithelium is displayed as a dot plot (below). (F) A row-normalized Jaccard index was calculated between clusters identified in the current analysis and transitional epithelial clusters identified in other studies. The intensity of color indicates relative similarity, with darker colors indicating higher similarity. (G) Cell-trajectory inference was calculated with CellRank, and probabilities of becoming a ‘transitional’ cell plotted. (H) Terminal state probabilities of the transitional cells. The bars are colored based on fraction of cells in each cluster present prenatally (gray) or postnatally (white). Central bars represent the median and range bars represent the interquartile range. (I) RNA ISH of Mdk (red) and Epcam (white, epithelial marker) at selected time points. For additional images see Fig. S2H. (J) Quantification of ISH using HALO for percent of Mdk+ epithelial cells (Epcam+Mdk+/Epcam+) cells over total epithelial cells. A non-parametric Kruskal–Wallis test was performed (***P<0.001). (K) RNA ISH of Cdkn1a (red, transitional cell marker), Sftpc (green, type II cell marker) and Hopx (white, type I cell marker) at selected time points. Cells that express Cdkn1a, Sftpc and Hopx are outlined in a dotted line. For channel-separated images see Fig. S3. (L) Quantification of ISH for percentage of transitional cells (Sftpc+Hopx+Cdkn1a+) cells over total epithelial cells. (M) Confocal micrographs of immunofluorescence and RNA ISH of pan-cytokeratin (PanCK, red), Sftpc (green) and Cdkn1a (white) at selected time points. Cells that express Cdkn1a and PanCK are outlined in a dotted line. For additional time points see Fig. S2I. Insets show magnification of boxed areas. (N) Distance from each transitional cell (PanCK+Cdkn1a+) to the nearest AT2 cell (Sftpc+) was calculated and plotted for each cell. Box and whisker plots show median values (middle bars) and first to third quartiles (boxes); whiskers indicate 1.5× the interquartile range, and dots are points outside the interquartile range. Scale bars: 25 µm.

