Fig. 4.
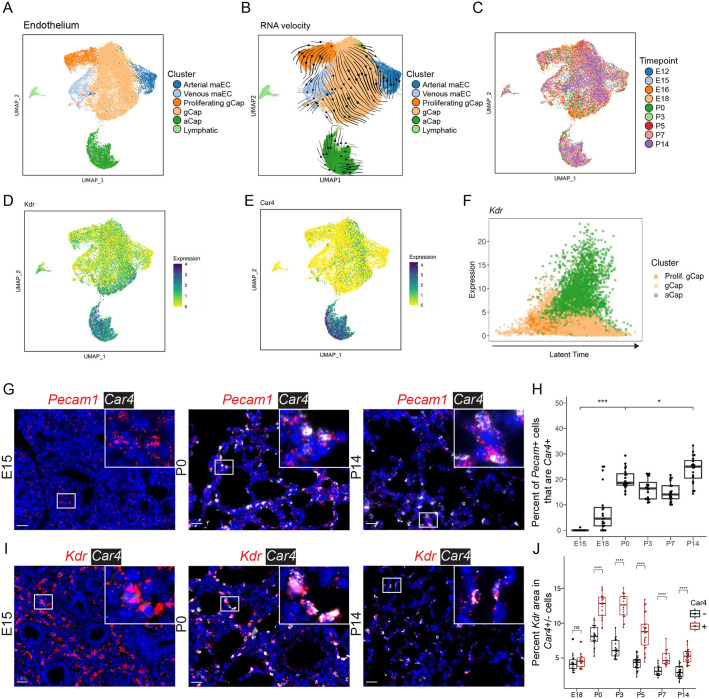
Endothelial cells undergo specification by E15, with subsequent emergence of Car4+ aCap cells by E18. (A) UMAP embedding of lung endothelial cells (n=22,237) colored by cell type. (B) RNA-velocity vectors of endothelial cells were calculated with CellRank and overlaid on the UMAP embedding. (C) UMAP embedding colored by time point. (D) UMAP embedding of endothelial cells colored by Kdr expression: darker colors indicate greater expression. (E) UMAP of Car4 expression. (F) Latent time analysis: latent time increases along the x-axis, shows expression of Kdr in aCap cells. (G) RNA ISH of Pecam1 (red; endothelial cell marker) and Car4 (white; aCap cell marker). A complete series is presented in Fig. S4F. (H) Quantification of ISH was performed using HALO; fraction of Pecam+ cells that are Car4+ was plotted. Boxplots represent pooled data, with each dot representing the percentage of Pecam+Car4+/Pecam+ cells per image (n=20 images per time point, from n=3 individual mice). Increases were observed from E15 to P0 and from P0 to P14. (I) RNA ISH of Kdr (red), and Car4 (white). Additional images are presented in Fig. S5. Insets show magnification of boxed areas. (J) Quantification of Kdr expression in Car4− (black) and Car4+ (red) cells. *P<0.05, ***P<0.001, ****P<0.0001: Mann–Whitney U-test. Box and whisker plots show median values (middle bars) and first to third quartiles (boxes); whiskers indicate 1.5× the interquartile range, and dots are points outside the interquartile range. Scale bars: 25 µm.

