Fig. 5.
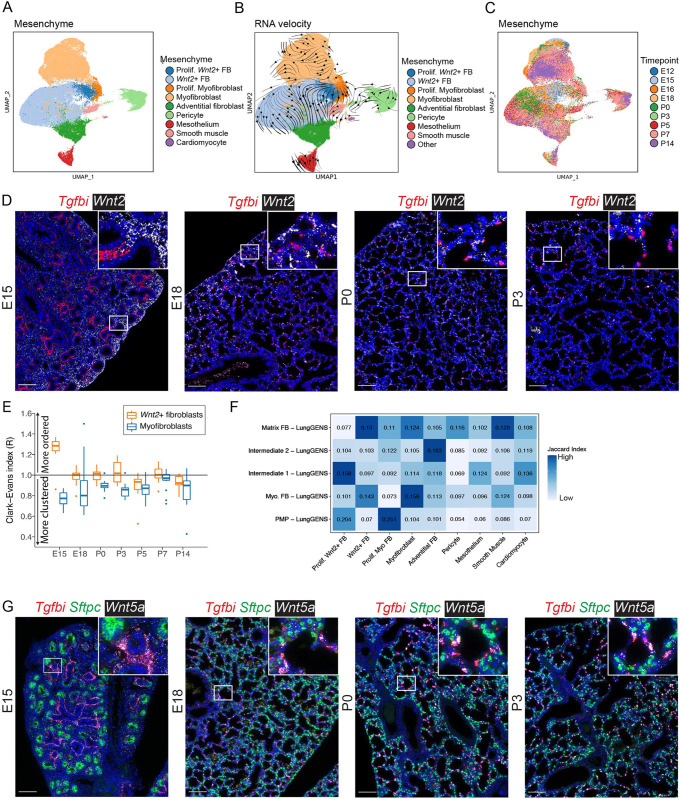
The mesenchymal cell population undergoes dynamic population shifts between P0 and P3. (A) UMAP embedding of lung mesenchymal cells (n=67,035) colored by cell type. (B) RNA-velocity vectors overlaid on the UMAP depict inferred differentiation/maturation trajectories. (C) UMAP embedding colored by time point. (D) RNA ISH of Tgfbi (red; myofibroblast marker) and Wnt2 (white; Wnt2+ fibroblast marker) at E15, E18, P0 and P3. Images are stitched scans. A complete time series of representative images is presented in Fig. S7C. (E) HALO analysis of the Tgfbi and Wnt2 ISH and assignment of cell identities based on marker expression. A Clark-Evans clustering index was calculated from individual cells and aggregated by image. Values >1.0 indicate that cells are more regularly spaced apart (ordered), whereas values <1.0 indicate progressively increased clustering. Box and whisker plots show median values (middle bars) and first to third quartiles (boxes); whiskers indicate 1.5× the interquartile range, and dots are points outside the interquartile range. (F) A row-normalized Jaccard index was calculated between clusters identified in this study and those from other studies. Increased saturation of blue box shading indicates higher similarity. (G) RNA ISH of Tgfbi (red; myofibroblast marker), Sftpc (green; type II cell marker) and Wnt5a (white) at E15, E18, P0 and P3. Images are stitched scans. A complete time series of representative images is presented in Fig. S8A. Insets show magnification of boxed areas. Scale bars: 100 µm.

