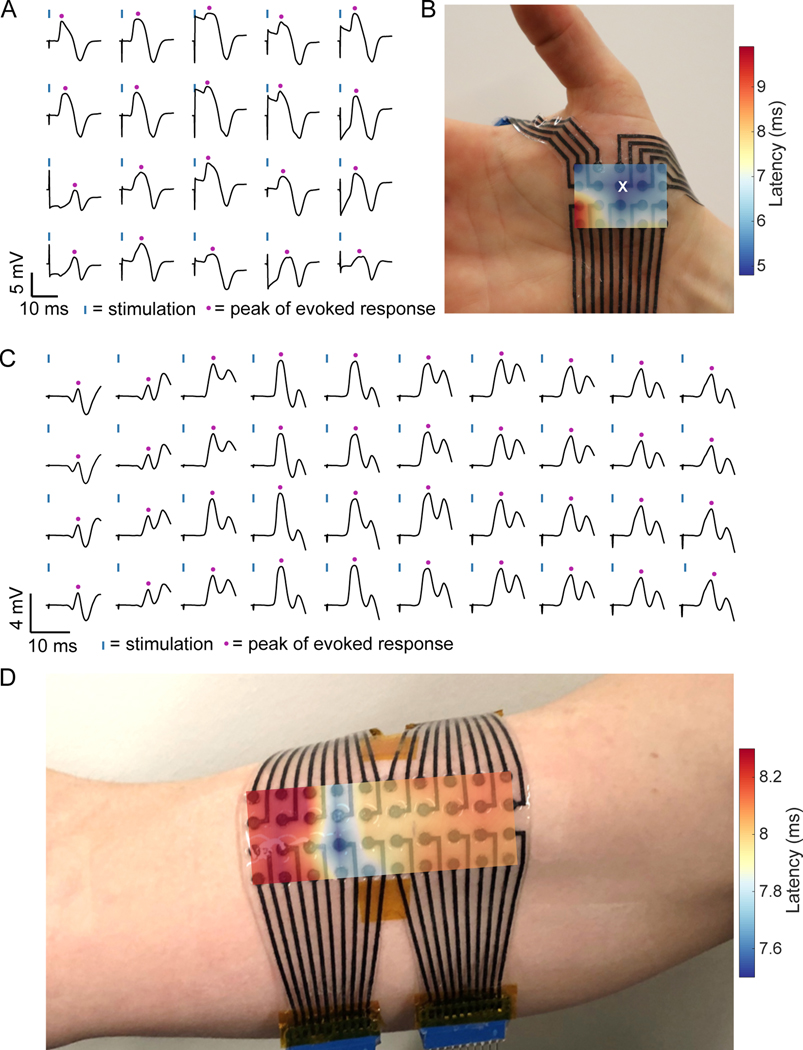
Fig. 4. High density surface EMG mapping with MXtrode arrays.
(A and B) EMG recordings from the APB muscle. (A) Average evoked response following N=10 median nerve stimulation epochs recorded on 20-ch MXtrode array placed over APB. Blue ticks indicate time of nerve stimulation, and purple dots indicate time of peak evoked response. (B) Latency map of peak response overlaid on photo of the MXtrode array on the APB. White “x” indicates the channel with shortest latency, corresponding to the IZ. (C and D) EMG recordings from the biceps muscle. (C) Average evoked response following N=10 supraclavicular nerve stimulation epochs recorded on 40-ch MXtrode array placed over the biceps. Blue ticks indicate time of nerve stimulation, and purple dots indicate time of peak evoked response. (D) Latency map of peak response overlaid on photo of the MXtrode array on the subject’s biceps. Distributed IZ running perpendicular to the muscle is apparent as the band with the shortest latency. Data collected from N=1 subject for each muscle group.

