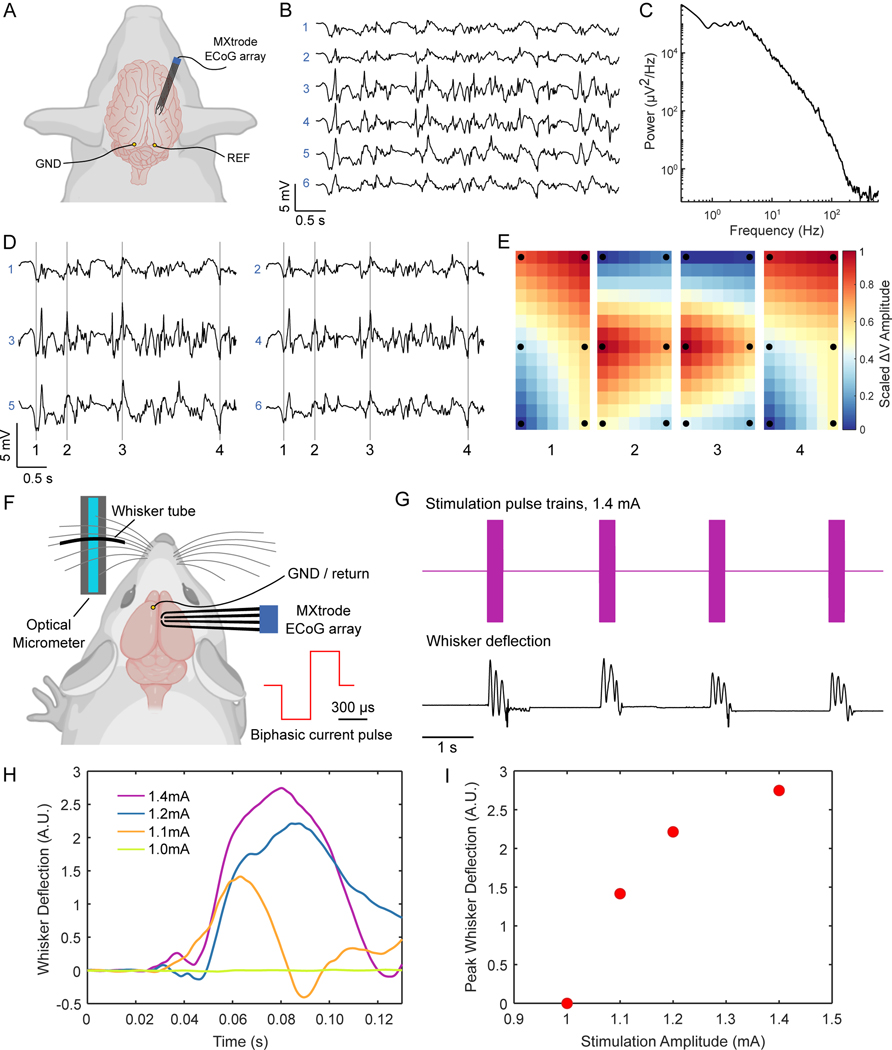
Fig. 6. ECoG recording and cortical stimulation with MXtrode arrays.
(A) Schematic depicting ECoG recording setup with the 6-ch array of 500 μm-diameter MXtrodes placed subdurally on somatosensory cortex of N=1 pig. (B) A few seconds of representative ECoG data recorded on the MXtrode array. (C) Power spectral density of the ECoG recording. (D) Segment of ECoG data, displayed according to the spatial arrangement of the 6 MXtrodes. (E) Instantaneous voltage mapping recorded across the 6 MXtrodes during down states (panels 1 and 4) and up states (panels 2 and 3). The timing of these voltage maps is indicated in (D) by the vertical lines. Voltage was interpolated across the array and normalized, with black dots indicating location of the 6 MXtrode contacts. (F) Schematic of the cortical stimulation setup, with the 4-ch array of 500 μm-diameter MXtrodes placed over barrel cortex, and the optical micrometer used to detect and amplify the whisker deflection signal in N=1 rat. (G) Whisker deflection data recorded by the optical micrometer during a series of stimulation pulse trains delivered at 1.4 mA. (H) Average first whisker deflection for each stimulation pulse amplitude, time-aligned by the stimulation onset (n=10 stimulation trails per current amplitude). (I) Scaling of whisker deflection amplitude with stimulation amplitude.

