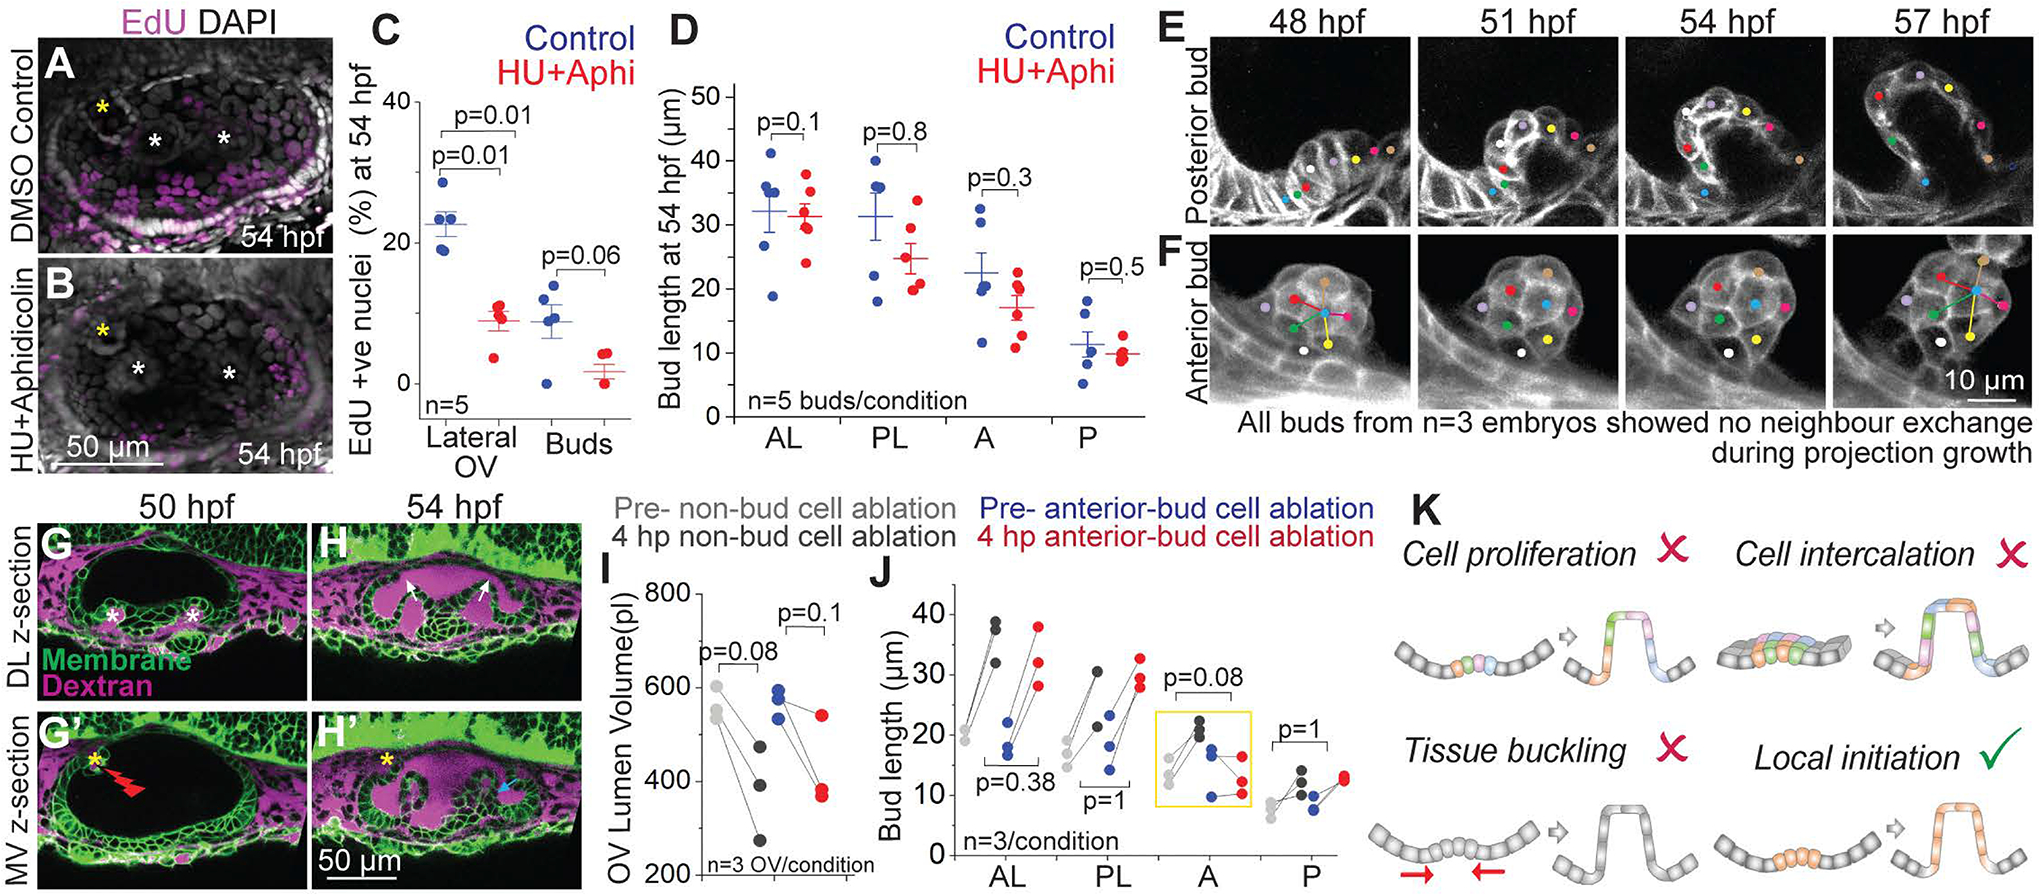
Figure 2-. Stereotypical morphogenic behaviors are not responsible for SCC morphogenesis.

(A and B) 3D rendered representative examples of OVs with DAPI and EdU staining marking all nuclei (grey) and nuclei in S phase (purple) respectively, in control (A), and Hydroxyurea (HU)+Aphidicolin treated embryos (B) at 54 hpf. Lateral buds are marked by white asterisks and anterior bud is marked by yellow asterisks. Anterior to the left and DL into the plane of view. Scale bar, 50 μm.
(C) Individual data points and mean±s.d. of percentage of EdU positive nuclei in the lateral region of the OV, and only in the buds. ‘n’ denotes the number of OVs. p values as labelled (Mann Whitney- U test).
(D) Individual data points and mean±s.d. of bud lengths in control and HU+Aphidicolin treated embryos at 54 hpf. In the absence of buds, lengths correspond to cell lengths. ‘n’ denotes the number of buds. p values as labelled (Mann Whitney- U test).
(E and F) 2D sections (E) and 3D rendering (F) of a posterior and an anterior bud respectively from membrane-labeled transgenic embryo at select time points with individual cells tracked (colored dots). Scale bar, 10 μm.
(G and H) 2D sections from two different z-depths of an ablated OV (marked by red flash) using Tg(βActin:membrane-Citrine) (green) and Texas-red dextran (magenta) in the periotic space. Lateral buds (marked by white asterisks) can be seen in the DL section (L). Anterior bud (marked by yellow asterisk) can be seen in the MV section (L’). Dextran dye enters the OV lumen upon ablation (M-M’). Lateral buds continue to extend in the ablated OV (marked by white arrows) (M’). Posterior bud also forms and extends (cyan arrow). Anterior bud ablation blocks its extension (yellow asterisk) (M’). Scale bar, 50 μm.
(I), OV lumen volume in control and experiment before and after ablation. ‘n’ denotes the number of OVs per condition. p values as labelled (Mann Whitney- U test).
(J) Bud lengths in control and experimental embryos before and 4 hours post (hp) ablation. ‘n’ denotes number of buds measured per condition. p values as labelled (Mann Whitney- U test).
(K) Illustrations show the models tested for budding morphogenesis.
