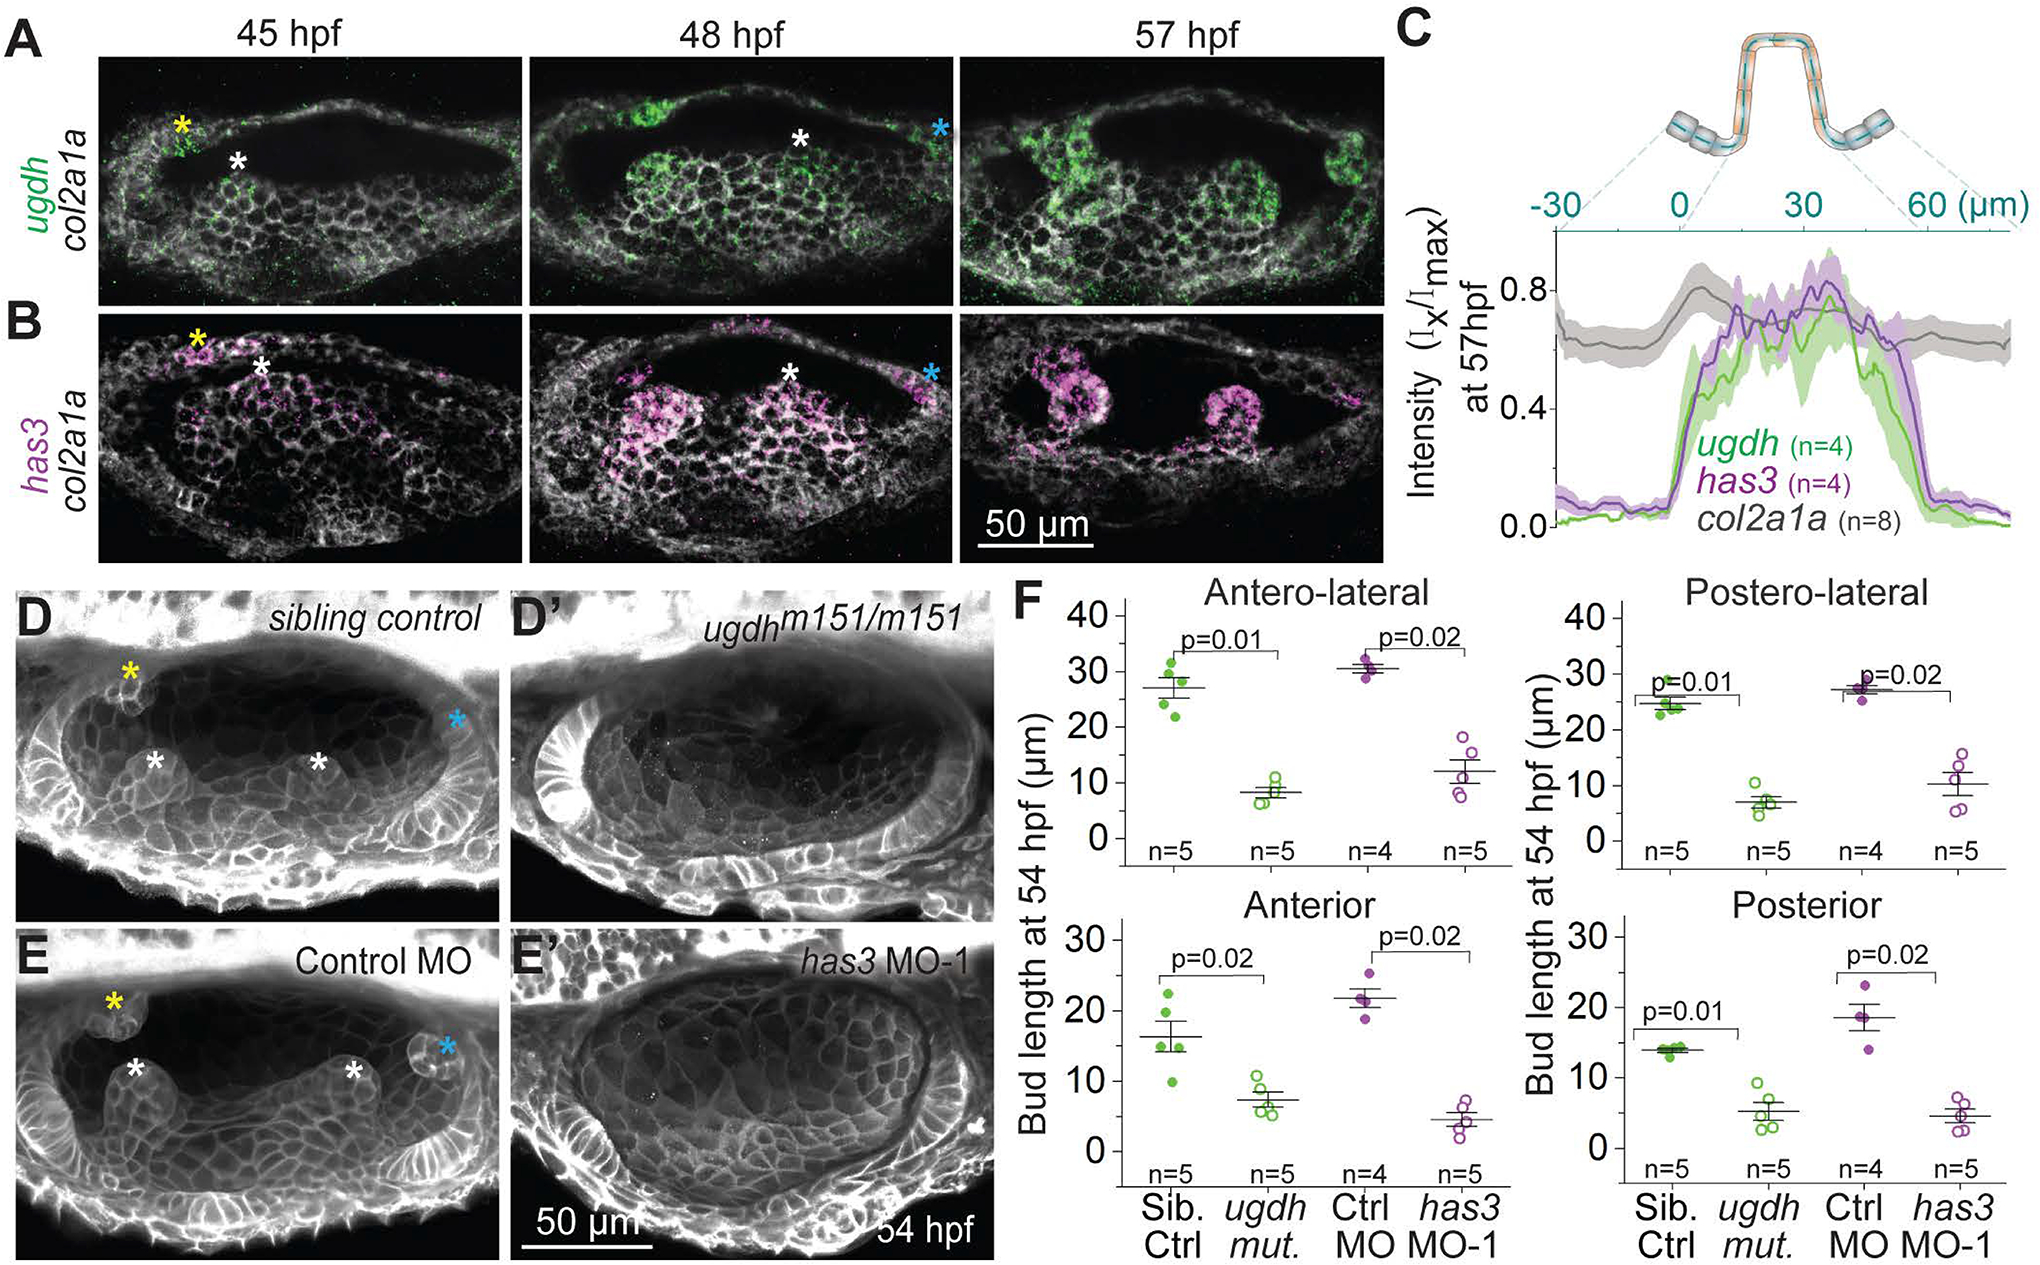
Figure 3-. SCC morphogenesis requires patterned expression of hyaluronan synthesis enzymes ugdh and has3.

(A and B) Maximum intensity projections of OVs at select time points stained with multiplex in situ probes against ugdh (green) and col2a1a (white) (A), and has3 (purple) and col2a1a (white)
(B). The z-volume is different across time points to capture all the buds, and hence the contrast of each time point is individually set for better visualization. Scale bar, 50 μm.
(C) Mean intensities±standard error (s.e.) of various genes across the illustrated region of interest (ROI) in the anterior bud at 57 hpf.
(D and E) Representative examples of 3D-rendered OVs at 54 hpf from sibling control and ugdhm151/m151 mutant embryos labelled with membrane-NeonGreen mRNA (D), and Tg(βActin:membrane-Citrine) embryos injected with control morpholino (MO) and has3-specific MO-1 (E). Buds in controls are marked by asterisk (white, yellow and cyan for lateral, anterior and posterior buds respectively). Genetically perturbed embryos have no buds. Anterior to the left and DL into the plane of view. Scale bar, 50 μm.
(F) Individual data points and mean±standard deviation (s.d.) of bud lengths in controls and genetic perturbations at 54 hpf. In the absence of buds, bud lengths correspond to cell lengths. ‘n’ denotes the number of buds measured per condition. p values as labelled (Mann Whitney- U test).
