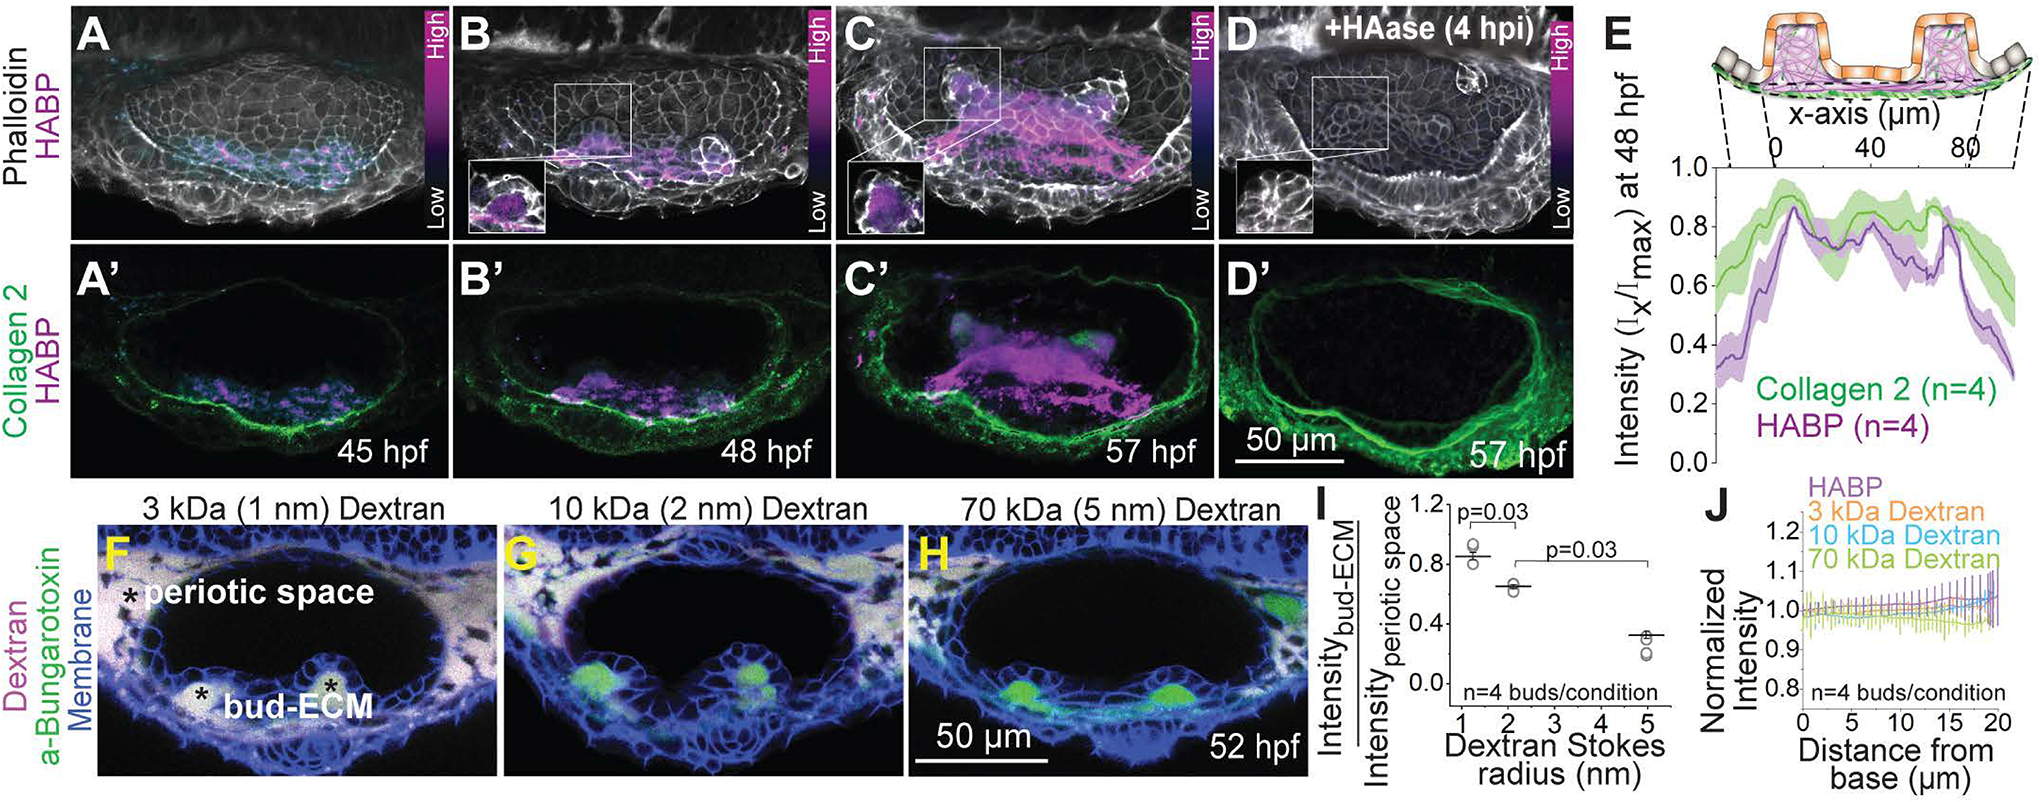
Figure 4-. The ECM of the buds is rich in hyaluronan and dense.

(A-D) 3D rendered OVs showing HA, F-actin and Collagen 2 staining using HA-Binding Protein (HABP), Phalloidin and Anti-Col2a1a respectively, at select time points in uninjected (A-C) and hyaluronidase (HAase) treated embryos (D). Anterior to the left and DL into the plane of view. The contrast of each time point is individually set to capture the dynamic range of HABP. Insets show 2D sections of the antero-lateral buds. Scale bar, 50 μm. ‘n’ denotes the number of buds.
(E) Mean intensities±s.e. of various stains across the illustrated ROI in the lateral buds at 48 hpf.
(F-H) 2D sections showing percolation of dextran from the periotic space into the bud-ECM 2 hours post injection (hpi). Different sizes of Texas-red dextran (in magenta)-3 kDa (F), 10 kDa (G) and 70 kDa (H) with approximate Stokes radii 1 nm, 2 nm and 5 nm respectively, were co-injected with aBt (green) in Tg(βActin:membrane-citrine) embryos (blue). aBt colocalizes with all three sizes of dextran in the periotic space (white). Contrast is same across embryos. Scale bar, 50 μm.
(I) Individual data points and mean±s.e. of fluorescent intensities of different sizes of dextran in the bud ECM normalized to their intensities in the periotic space. ‘n’ denotes the number of buds per condition. p values as labelled (Mann Whitney- U test).
(HJ) Mean±s.e. of the normalized fluorescent intensities of different sizes of dextran and HABP in the bud ECM from the base to the tip (as show in the illustration Figure S3C). ‘n’ denotes the number of buds per condition.
