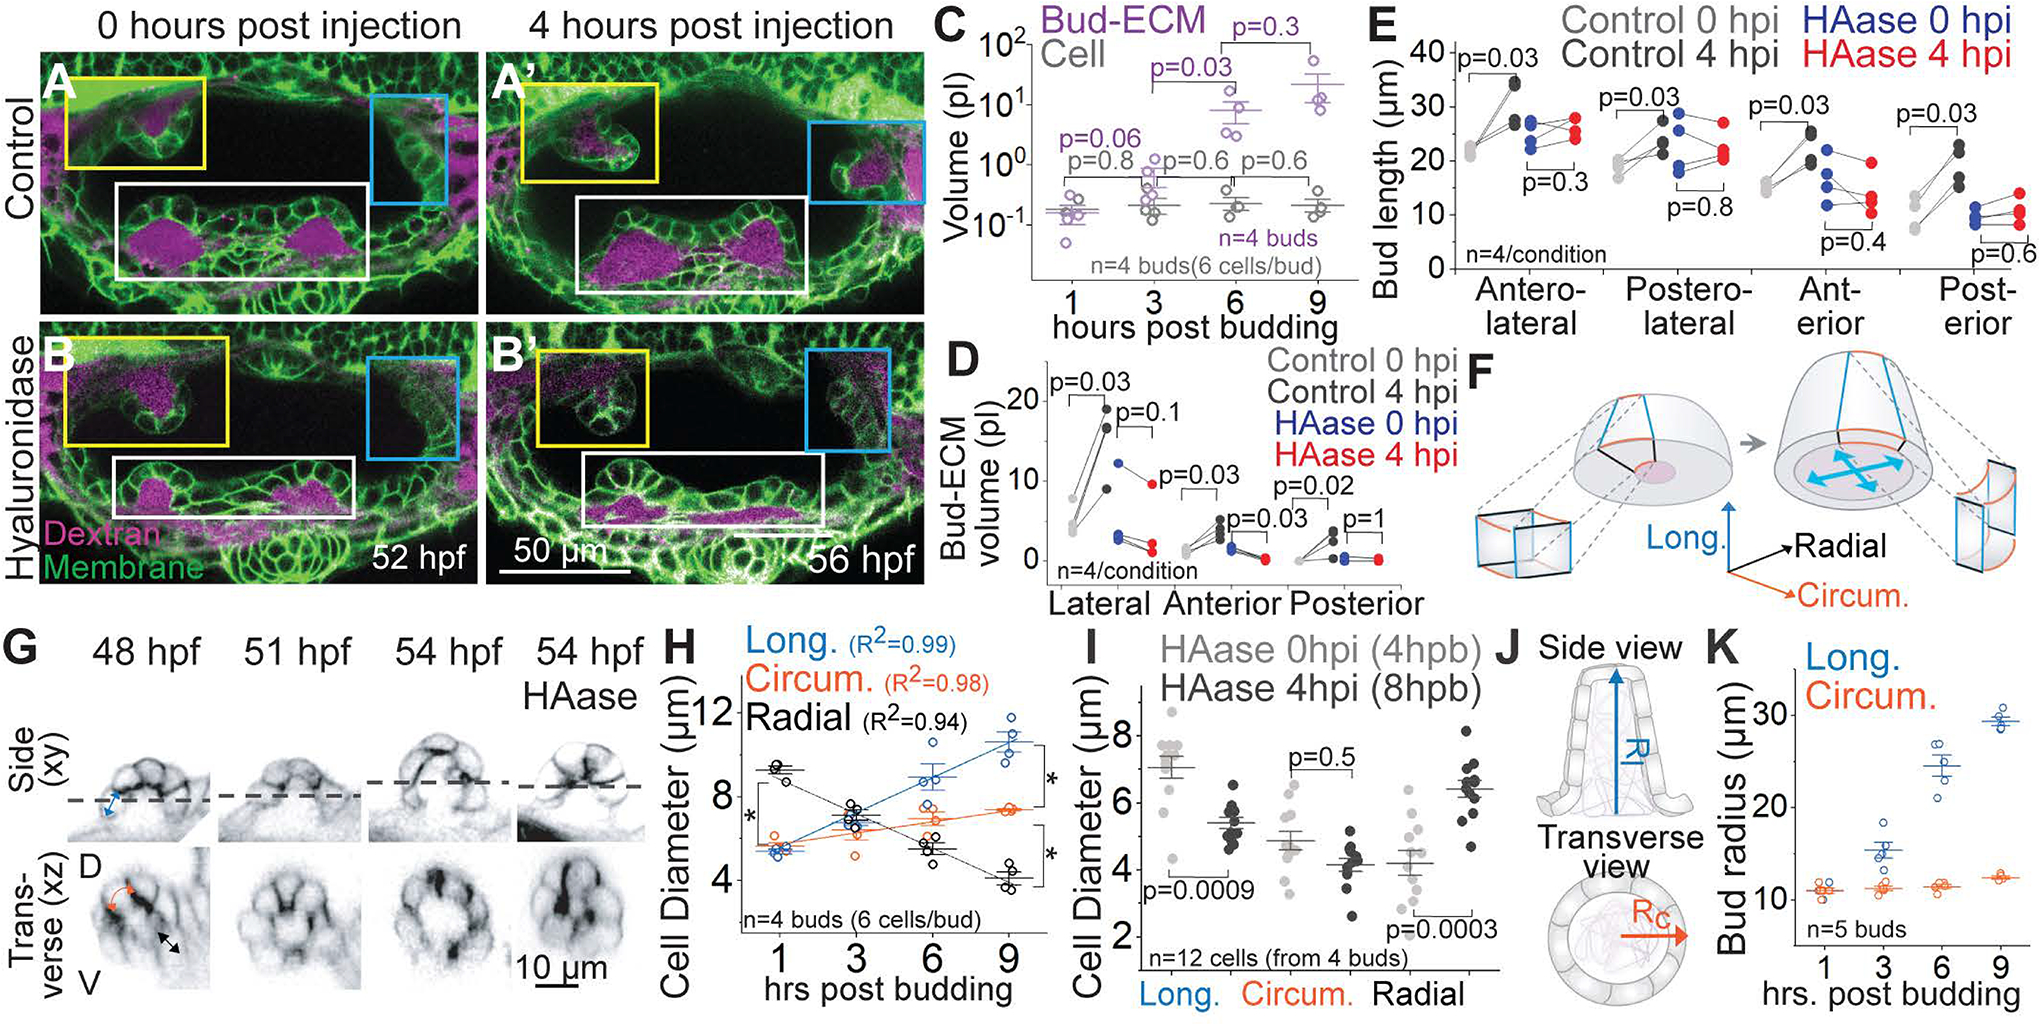
Figure 5 -. Hyaluronate drives tissue and cellular morphogenesis through isotropic pressure.

(A and B) Composite of 2D sections of representative examples from controls (A) and HAase injected (B) embryos at 0 and 4 hours post injection (hpi) using Tg(βActin:membrane-Citrine) (green) and Texas-red dextran (magenta) in the periotic space. Lateral, anterior and posterior buds from different z-depths are framed in white, yellow and cyan respectively. Scale bar, 50 μm.
(C) Individual data points and mean±s.d. of bud-ECM and cell volume across time. Each data point for cell volume is an average from 6 cells in a bud. ‘n’ denotes the number of buds per condition. p values as labelled (Mann Whitney- U test).
(D and E) Bud-ECM volume (D) and bud lengths (E) in control and HAase injected embryos at 0 and 4 hpi. In the absence of buds, lengths correspond to cell lengths. ‘n’ denotes the number of bud-ECMs or buds respectively. p values as labelled (Mann Whitney- U test).
(F) Illustration showing the longitudinal (blue), circumferential (orange) and radial (black) axes of cells during budding. Deposition of HA in the bud-ECM is shown in purple. Cyan arrows show hydrostatic pressure from HA swelling. Notice the change in aspect ratio of the cells before and after HA-swelling.
(G) Side and transverse sections of an anterior bud from an uninjected embryo at select time points, and HAase treated embryo at 54 hpf, using Tg(βActin:membrane-Citrine). Dotted line in side view (xy) marks the y position for transverse view (xz). Scale bar, 10 μm.
(H) Individual data points and mean±s.d. of cell diameters across time (hours post budding, hpb). *denotes p=0.03 (Mann Whitney- U test). Each data point is an average from 6 cells per bud. ‘n’ denotes the number of buds.
(I) Individual data points and mean±s.d. of cell diameters in HAase-treated embryos at 0 and 4 hpi. Each data point is the diameter of a single cell. ‘n’ denotes the number of cells. p values as labelled (Mann Whitney- U test).
(J) Illustration showing the longitudinal (Rl) and circumferential radius (RC) of the bud.
(K) Individual data points and mean±s.d. of bud radii across time. ‘n’ denotes the number of buds.
