
Fig. 3. SDF-1/CXCR4 interactions tether dormant BCCs to the vascular niche.
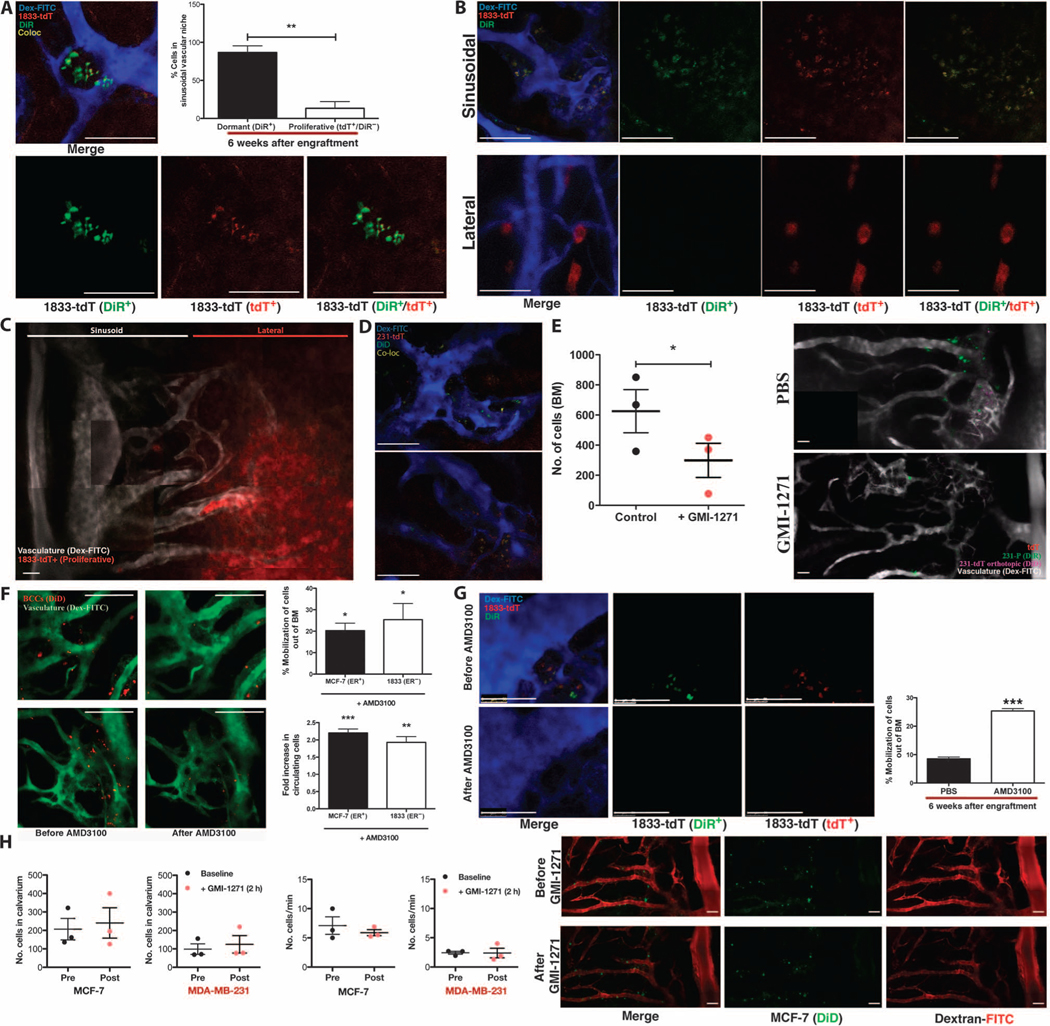
(A) Six weeks after intracardiac engraftment, dormant BCCs (DiR+tdT+) are detected in clusters localized to the sinusoidal vascular region of calvarial BM. Representative images are shown. The percentage of dormant (DiR+tdT+) versus proliferative (DiR−tdT+) BCCs in the sinusoidal niche was calculated (**P = 0.0042, n = 3 mice; unpaired, two-way t test). (B and C) In mice with proliferative bone tumors, rapidly dividing BCCs (DiR−tdT+) were found in distinct lateral, nonsinusoidal regions of BM [representative images of n = 4 experiments; (C) is a montage containing multiple images]. (D) Dormant (DiD+tdT+) BCCs that spontaneously metastasized to bone from orthotopic tumors were detected in the sinusoidal vascular niche at 48 to 79 days. (E) Forty-eight to 79 days after orthotopic engraftment of DiD-labeled tdT+ BCCs, mice were treated ± GMI-1271 and engrafted with DiR-labeled BCCs. DiR-BCCs homed to sinusoids in orthotopic tumor-engrafted mice, with a twofold homing reduction in GMI-1271–treated mice (*P = 0.0126, n = 3; unpaired, two-way t test). Representative images are shown (montage containing multiple images). (F) One day after engraftment, mice were treated ± AMD3100, and images of the calvarium were obtained before and 2 hours after treatment to determine the percentage of BCCs mobilized from BM (MCF-7: *P = 0.0455, n = 3; 1833: *P = 0.0300, n = 4; unpaired, two-way t test). Video-rate microscopy was used to assess the fold increase in peripherally circulating BCCs (MCF-7: ***P = 0.0005, n = 3; 1833: **P = 0.0069, n = 4; unpaired, two-way t test). Representative images are shown. (G) Six weeks after engraftment, mice were treated ± AMD3100. The percentage of dormant DiR+tdT+ BCCs mobilized from BM was calculated (***P = 0.0008, n = 3; unpaired, two-way t test). Representative images are shown. (H) One day after engraftment, mice were treated ± GMI-1271. Images before and 2 hours after treatment demonstrated no significant mobilization of BCCs from BM (n = 3 mice for each cell line; unpaired, two-way t test). Representative images are shown (montage containing multiple images). Scale bars, 100 μm.