
Table 1.
Comparison of Yield and Epimerization between Peptides Synthesized with either DBU or Piperidinea
| |||
|---|---|---|---|
| Peptideb | Epimerization (%) |
Purity (%)c |
Yield (%) |
| KAFSAKμ (1) – piperidine | 16.1 | 56.2 | 29.9 |
| KAFSAKμ (1) – DBU | 5.0d | 61.1 | 35.9 |
| FSAKAKμ (2) – piperidine | 1.0 | 89.0 | 44.3 |
| FSAKAKμ (2) – DBU | 0.0 | 88.5 | 51.3 |
| FASKAKμ (3) – piperidine | 3.2 | 68.5 | 44.0 |
| FASKAKμ (3) – DBU | 1.0 | 67.3 | 44.7 |
| FAESAKμ (5) – piperidine | 5.6 | 71.5 | 18.2 |
| FAESAKμ (5) – DBU | 1.0 | 71.6 | 22.7 |
| CVNYSEEFVQMMTAK (6) – piperidine | 49.9 | 8.6 | n/dd |
| CVNYSEEFVQMMTAK (6) – DBU | 9.3 | 12.3 | n/dd |
| CVNYEEFSVQMMTAK (7) – piperidine | 28.1 | 25.0 | n/dd |
| CVNYEEFSVQMMTAK (7) – DBU | 4.5e | 22.0e | n/dd |
a
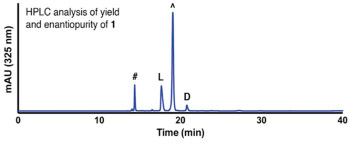
Graph: Example chromatogram for epimer quantification and yield determination. l and d denote epimers of 1, KAFSAKμ and KAfSKμ, respectively, # denotes KAAKμ, the product of failed FS coupling. ^ denotes Mca standard used to quantify yield.
b
Peptides in one-letter code. Superscript S denotes thioamino acids; μ = 7-methoxycoumarin-4-yl-alanine.
c
Purity calculation based on HPLC peak area of desired product.
d
No external standard added for yield quantification.
e
Average of two experiments.